NVIDIA GeForce RTX 4090 Laptop GPU
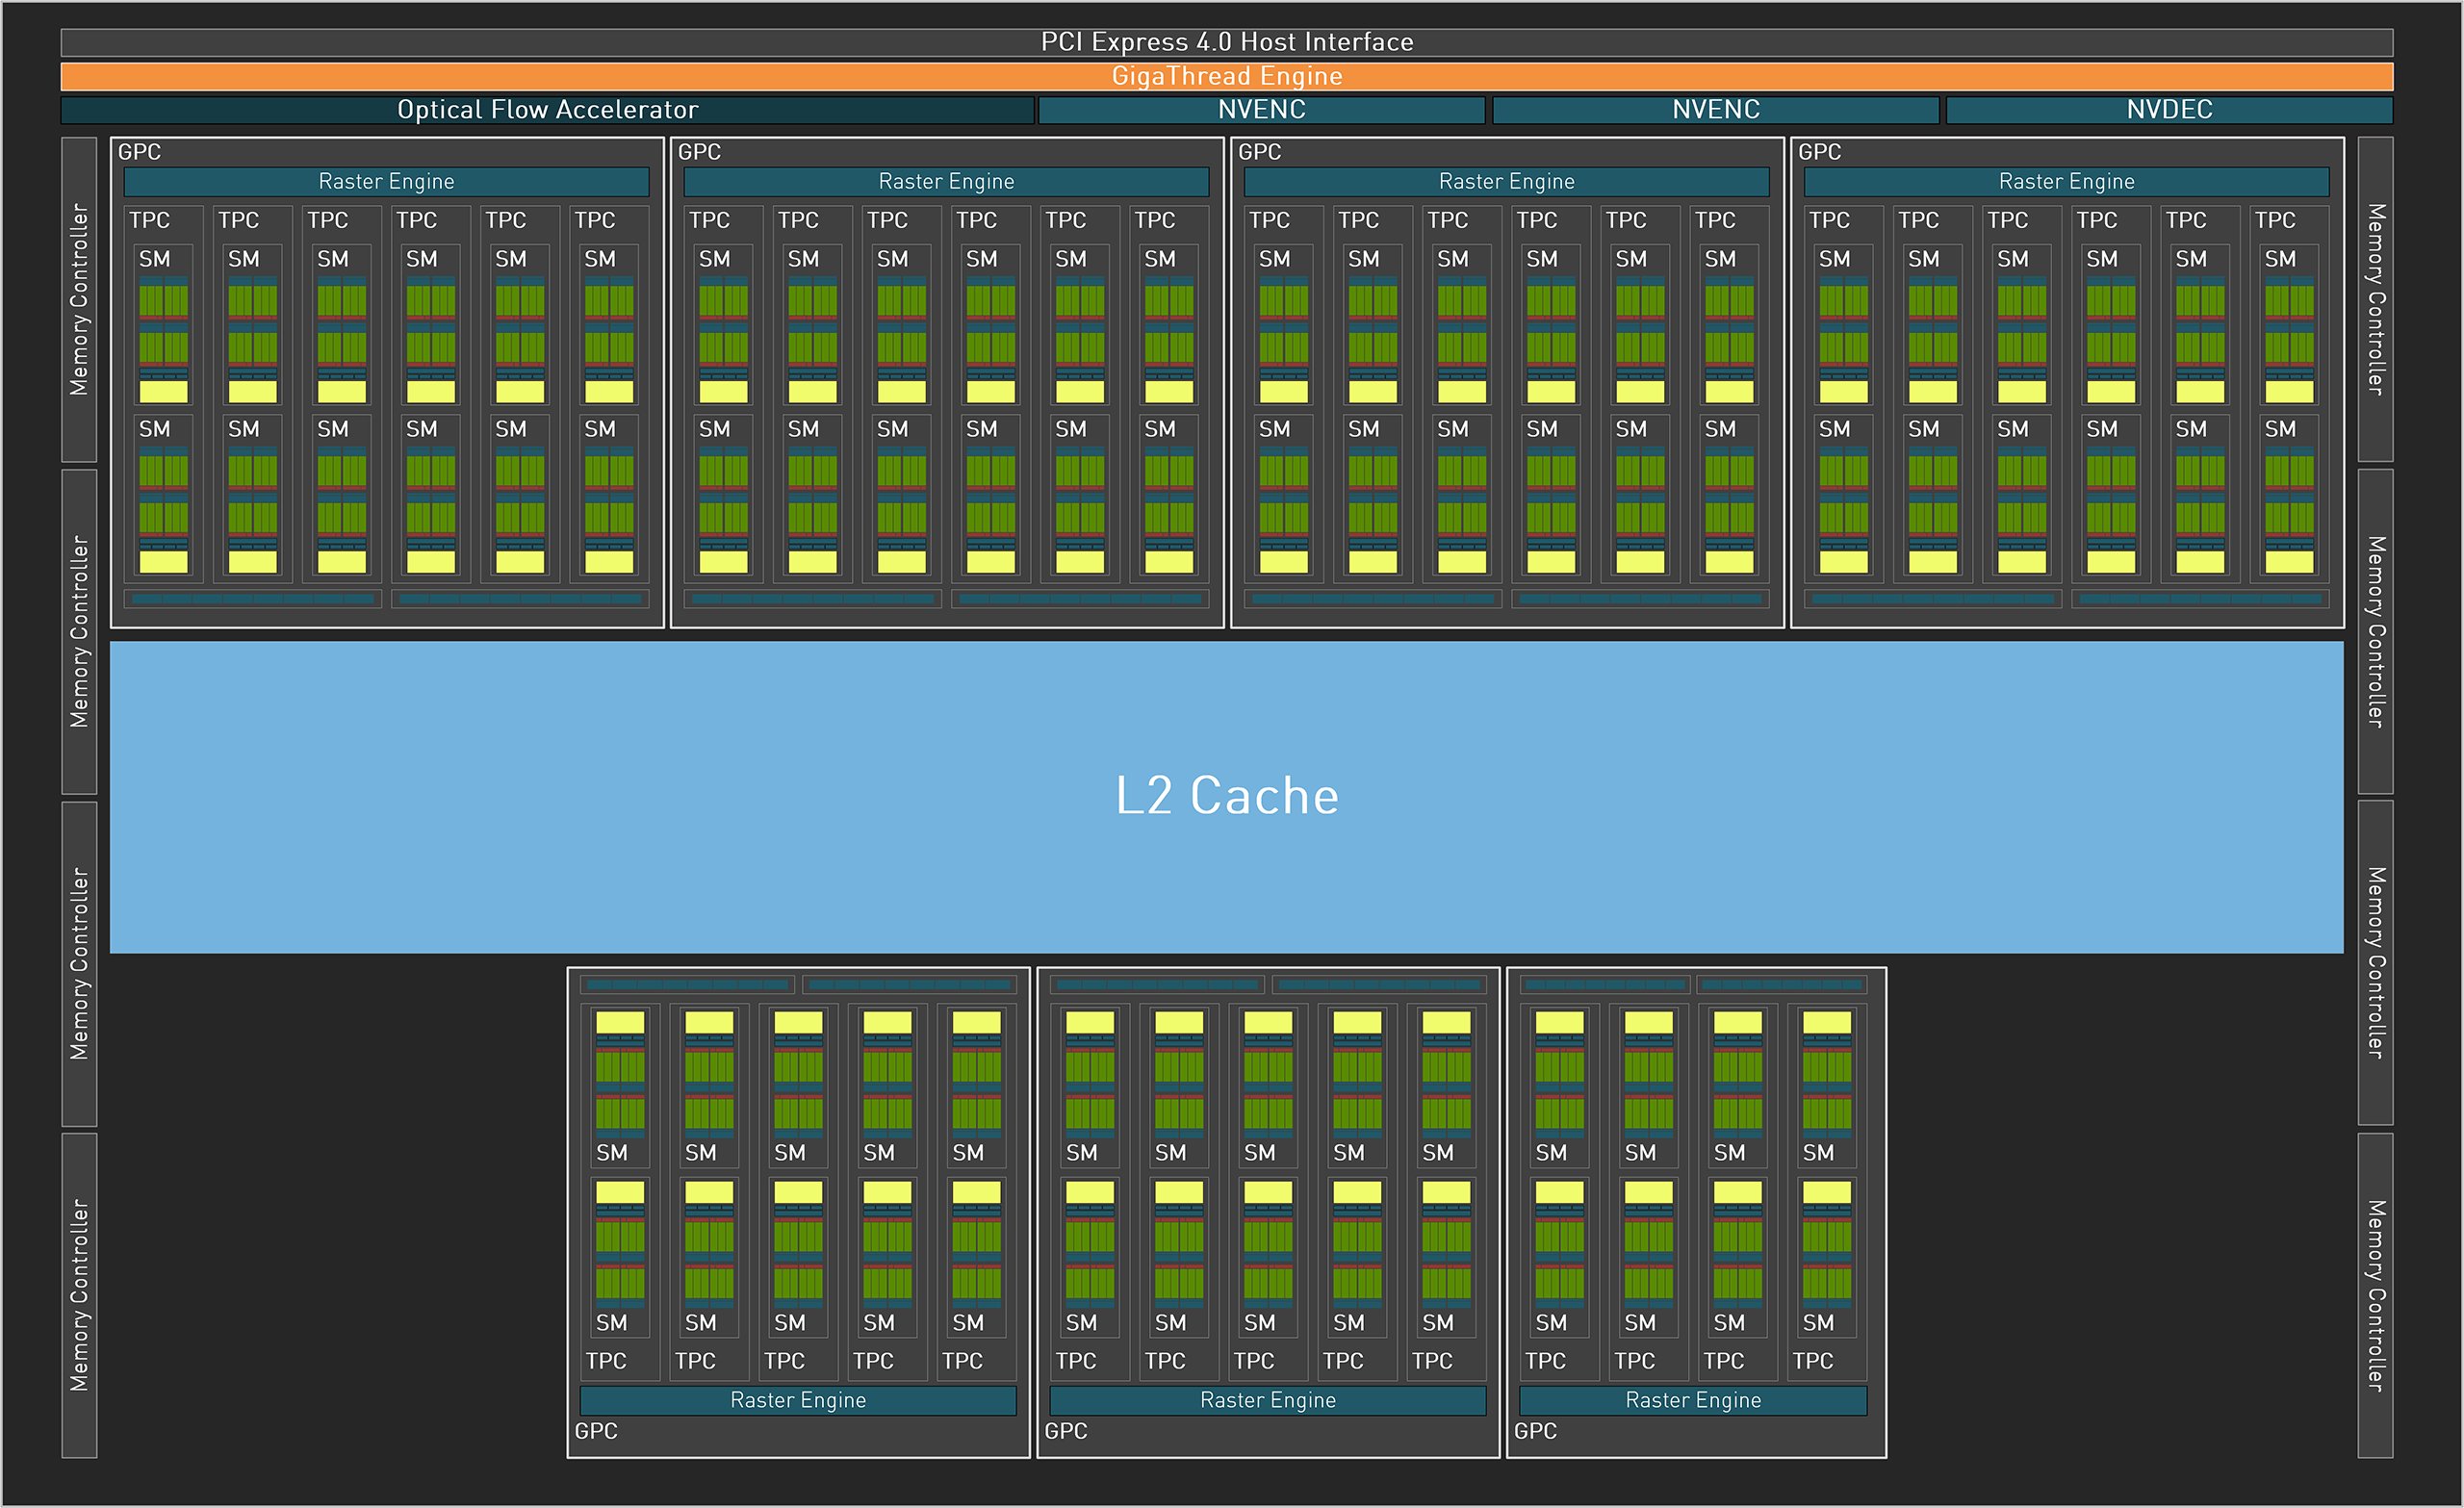
The NVIDIA GeForce RTX 4090 Laptop GPU (Codename GN21-X11) is a high-end laptop GPU. It is based on the AD103 chip as the desktop RTX 4080 and use the Ada Lovelace architecture. The AD103 chip offers a maximum of 10.752 shaders from which inly 9728 are used (e.g., the RTX 4080 Desktop uses 9.728) and a 256 Bit memory bus. The RTX 4090 mobile uses 16 GB GDDR6 dedicated graphics memory with a clock speed of 20 Gbps (effective). The TGP (Total Graphics Power) can be configured between 80 and 150 Watt (+ 15 Watt Dynamic Boost from the CPU) leading to different performance levels (the desktop RTX 4080 uses 320 Watt for comparisons).
The performance depenends on the TGP settings which defines the maximum boost clock (1455 MHz for 80W and up to 2040 MHz for 150W). With 150W the performance should be in the region of the desktop RTX 4080 and therefore best suited for 4k60 or 2k with 120 fps for demanding games. For raytracing, lower resolutions or DLSS is needed.
In our reviews, an average RTX 4090 is clearly the fastest mobile GPU and bests the RTX 4080 Laptop GPU and mobile RTX 3080 Ti easily. 4090M GPUs with lower power limit can however loose up to 20% performance.
In games, fast RTX 4090 models allow gaming in 4k with maximum details. Adding Raytracing may lead to frame rates below 60 fps (e.g. F1 23) and therefore the use of DLSS or reduced settings are advised.
The AD103 chip of the RTX 4090 mobile is manufactured in an improved 5 nm process at TSMC (4N).
GeForce RTX 4000 Laptop GPU Series Codename GN21-X11 Architecture Ada Lovelace Pipelines 9728 - unified TMUs 304 ROPs 112 Raytracing Cores 76 Tensor / AI Cores 304 Core Speed 2040 (Boost) MHz Cache L2: 64 MB Memory Speed 20000 effective = 2250 MHz Memory Bus Width 256 Bit Memory Type GDDR6 Max. Amount of Memory 16 GB Shared Memory no Memory Bandwidth 576 GB/s API DirectX 12 Ultimate, Shader 6.7, OpenGL 4.6, OpenCL 3.0, Vulkan 1.3 Power Consumption 150 Watt (80 - 150 Watt TGP) Transistor Count 76.3 Billion technology 5 nm PCIe 4 x16/x8 Displays 4 Displays (max.), HDMI 2.1, DisplayPort 1.4a Notebook Size large Date of Announcement 03.01.2023 Link to Manufacturer Page www.nvidia.com Predecessor GeForce RTX 3080 Ti Laptop GPU
Benchmarks Performance Rating - 3DMark 11 + Fire Strike + Time Spy
21.1 pt (63%)
...
NVIDIA GeForce RTX 4090 Laptop GPU
max:
3DMark - 3DMark Time Spy Score
min: 15939 avg: 19642 median: 20085 (58%) max: 22014 Points
GPU TDP ? TDP 125 W TDP 150 W TDP 175 W 100% 80% 79% 96%
...
NVIDIA GeForce RTX 4090 Laptop GPU
max:
3DMark - 3DMark Time Spy Graphics
min: 17620 avg: 20957 median: 21279 (56%) max: 23292 Points
GPU TDP ? TDP 125 W TDP 150 W TDP 175 W 100% 80% 81% 96%
...
NVIDIA GeForce RTX 4090 Laptop GPU
max:
3DMark - 3DMark Ice Storm Unlimited Graphics
min: 538912 avg: 608368 median: 554375 (64%) max: 731818 Points
...
NVIDIA GeForce RTX 4090 Laptop GPU
...
max:
3DMark - 3DMark Ice Storm Extreme Graphics
min: 510556 avg: 549555 median: 524379 (67%) max: 613731 Points
...
NVIDIA GeForce RTX 4090 Laptop GPU
max:
3DMark - 3DMark Cloud Gate Score
min: 52227 avg: 62207 median: 64860 (69%) max: 70984 Points
GPU TDP ? TDP 175 W 100% 89%
...
NVIDIA GeForce RTX 4090 Laptop GPU
3DMark - 3DMark Cloud Gate Graphics
min: 95671 avg: 140652 median: 142552 (37%) max: 164399 Points
GPU TDP ? TDP 175 W 100% 84%
...
NVIDIA GeForce RTX 4090 Laptop GPU
...
max:
3DMark - 3DMark Fire Strike Standard Score
min: 31174 avg: 35900 median: 35217.5 (62%) max: 43163 Points
GPU TDP ? TDP 125 W TDP 150 W TDP 175 W 98% 96% 91% 100%
...
NVIDIA GeForce RTX 4090 Laptop GPU
max:
3DMark - 3DMark Fire Strike Standard Graphics
min: 41210 avg: 46746 median: 46386 (52%) max: 53059 Points
GPU TDP ? TDP 125 W TDP 150 W TDP 175 W 100% 89% 93% 100%
...
NVIDIA GeForce RTX 4090 Laptop GPU
max:
3DMark - 3DMark Ice Storm Graphics
min: 550855 avg: 595673 median: 566331 (68%) max: 669833 Points
...
NVIDIA GeForce RTX 4090 Laptop GPU
max:
3DMark - 3DMark Wild Life Unlimited
min: 34577 avg: 98737 median: 130405 (66%) max: 131230 Points
GPU TDP 150 W TDP 175 W 26% 100%
...
NVIDIA GeForce RTX 4090 Laptop GPU
...
max:
3DMark - 3DMark Wild Life Extreme Unlimited
min: 34519 avg: 40582 median: 40668 (47%) max: 44487 Points
GPU TDP 125 W TDP 175 W 82% 100%
...
Apple M3 Max 40-Core GPU
NVIDIA GeForce RTX 4090 Laptop GPU
max:
3DMark - 3DMark Night Raid
min: 65684 avg: 72553 median: 69939 (66%) max: 82037 Points
...
NVIDIA GeForce RTX 4090 Laptop GPU
max:
3DMark - 3DMark Night Raid Graphics Score
min: 163096 avg: 172197 median: 165244 (64%) max: 188250 Points
...
NVIDIA GeForce RTX 4090 Laptop GPU
max:
3DMark 11 - 3DM11 Performance Score
min: 39551 avg: 45518 median: 46207 (64%) max: 50411 Points
GPU TDP ? TDP 125 W TDP 150 W TDP 175 W 100% 88% 87% 97%
...
NVIDIA GeForce RTX 4090 Laptop GPU
max:
3DMark 11 - 3DM11 Performance GPU
min: 56764 avg: 65475 median: 65531 (56%) max: 73027 Points
GPU TDP ? TDP 125 W TDP 150 W TDP 175 W 100% 82% 89% 96%
...
NVIDIA GeForce RTX 4090 Laptop GPU
max:
3DMark Vantage + 3DMark Vantage - 3DM Vant. Perf. total
113387 Points (33%)
...
NVIDIA GeForce RTX 4090 Laptop GPU
max:
3DM Vant. Perf. GPU no PhysX + 3DMark Vantage - 3DM Vant. Perf. GPU no PhysX
132443 Points (75%)
...
NVIDIA GeForce RTX 4090 Laptop GPU
max:
3DMark 05 - 3DMark 05 - Standard
61850 Points (68%)
...
NVIDIA GeForce RTX 4090 Laptop GPU
max:
3DMark 06 3DMark 06 - Standard 1280x1024 +
min: 60717 avg: 64507 median: 64691.5 (89%) max: 67927 Points
...
NVIDIA GeForce RTX 4090 Laptop GPU
max:
Unigine Valley 1.0 - Unigine Valley 1.0 DX
232 fps (76%)
...
NVIDIA GeForce RTX 4090 Laptop GPU
max:
Blender - Blender 3.3 Classroom CUDA *
min: 16 avg: 18.3 median: 18 (3%) max: 23 Seconds
GPU TDP ? TDP 125 W TDP 150 W TDP 175 W 101% 100% 101% 101%
...
NVIDIA GeForce RTX 4090 Laptop GPU
...
Blender - Blender 3.3 Classroom OPTIX *
min: 9 avg: 11.7 median: 11 (4%) max: 15 Seconds
GPU TDP ? TDP 125 W TDP 150 W TDP 175 W 101% 100% 100% 101%
NVIDIA GeForce RTX 4090 Laptop GPU
...
SPECviewperf 12 + SPECviewperf 12 - specvp12 sw-03
110 fps (31%)
...
NVIDIA GeForce RTX 4090 Laptop GPU
...
max:
specvp12 snx-02 + SPECviewperf 12 - specvp12 snx-02
19.2 fps (3%)
...
NVIDIA GeForce RTX 4090 Laptop GPU
...
max:
NVIDIA RTX 6000 Ada Generation
specvp12 showcase-01 + SPECviewperf 12 - specvp12 showcase-01
278 fps (61%)
...
NVIDIA GeForce RTX 4090 Laptop GPU
max:
NVIDIA RTX 6000 Ada Generation
specvp12 mediacal-01 + SPECviewperf 12 - specvp12 mediacal-01
157 fps (45%)
...
NVIDIA GeForce RTX 4090 Laptop GPU
max:
specvp12 maya-04 + SPECviewperf 12 - specvp12 maya-04
277 fps (75%)
...
NVIDIA GeForce RTX 4090 Laptop GPU
max:
specvp12 energy-01 + SPECviewperf 12 - specvp12 energy-01
42.3 fps (38%)
...
NVIDIA GeForce RTX 4090 Laptop GPU
max:
specvp12 creo-01 + SPECviewperf 12 - specvp12 creo-01
103 fps (41%)
...
NVIDIA GeForce RTX 4090 Laptop GPU
...
max:
NVIDIA RTX 6000 Ada Generation
specvp12 catia-04 + SPECviewperf 12 - specvp12 catia-04
196 fps (37%)
...
NVIDIA GeForce RTX 4090 Laptop GPU
max:
specvp12 3dsmax-05 + SPECviewperf 12 - specvp12 3dsmax-05
410 fps (72%)
...
NVIDIA GeForce RTX 4090 Laptop GPU
max:
SPECviewperf 13 specvp13 sw-04 + SPECviewperf 13 - specvp13 sw-04
min: 140.08 avg: 151.7 median: 156 (48%) max: 159.12 fps
...
NVIDIA GeForce RTX 4090 Laptop GPU
max:
specvp13 snx-03 + SPECviewperf 13 - specvp13 snx-03
min: 31.45 avg: 33 median: 33.1 (5%) max: 34.38 fps
...
NVIDIA GeForce RTX 4090 Laptop GPU
...
max:
specvp13 showcase-02 + SPECviewperf 13 - specvp13 showcase-02
min: 230.78 avg: 256.3 median: 257 (56%) max: 281.1 fps
...
NVIDIA GeForce RTX 4090 Laptop GPU
max:
NVIDIA RTX 6000 Ada Generation
specvp13 medical-02 + SPECviewperf 13 - specvp13 medical-02
min: 119 avg: 120.7 median: 120.3 (32%) max: 122.82 fps
...
NVIDIA GeForce RTX 4090 Laptop GPU
max:
specvp13 maya-05 + SPECviewperf 13 - specvp13 maya-05
min: 494.02 avg: 557 median: 576 (65%) max: 600.78 fps
...
NVIDIA GeForce RTX 4090 Laptop GPU
...
max:
specvp13 energy-02 + SPECviewperf 13 - specvp13 energy-02
min: 70.56 avg: 72.7 median: 72.8 (32%) max: 74.73 fps
...
NVIDIA GeForce RTX 4090 Laptop GPU
max:
NVIDIA RTX 6000 Ada Generation
specvp13 creo-02 + SPECviewperf 13 - specvp13 creo-02
min: 377.82 avg: 423 median: 430 (70%) max: 461.26 fps
...
NVIDIA GeForce RTX 4090 Laptop GPU
max:
specvp13 catia-05 + SPECviewperf 13 - specvp13 catia-05
min: 266.33 avg: 272.6 median: 270 (33%) max: 281.44 fps
...
NVIDIA GeForce RTX 4090 Laptop GPU
max:
specvp13 3dsmax-06 + SPECviewperf 13 - specvp13 3dsmax-06
min: 305 avg: 338.6 median: 338.2 (59%) max: 372.51 fps
...
NVIDIA GeForce RTX 4090 Laptop GPU
max:
SPECviewperf 2020 v1 specvp2020 solidworks-05 1080p + SPECviewperf 2020 v1 - specvp2020 solidworks-05 1080p
min: 426.16 avg: 462.7 median: 462.7 (93%) max: 499.25 fps
...
NVIDIA GeForce RTX 4090 Laptop GPU
specvp2020 snx-04 1080p + SPECviewperf 2020 v1 - specvp2020 snx-04 1080p
min: 31.26 avg: 33.2 median: 33.6 (6%) max: 34.28 fps
...
NVIDIA GeForce RTX 4090 Laptop GPU
...
specvp2020 medical-03 1080p + SPECviewperf 2020 v1 - specvp2020 medical-03 1080p
min: 55.09 avg: 57.8 median: 58.1 (63%) max: 59.9 fps
...
NVIDIA GeForce RTX 4090 Laptop GPU
specvp2020 maya-06 1080p + SPECviewperf 2020 v1 - specvp2020 maya-06 1080p
min: 528.8 avg: 557 median: 530.5 (87%) max: 610.71 fps
...
NVIDIA GeForce RTX 4090 Laptop GPU
...
specvp2020 energy-03 1080p + SPECviewperf 2020 v1 - specvp2020 energy-03 1080p
min: 70.65 avg: 74.6 median: 75.5 (69%) max: 76.5 fps
...
NVIDIA GeForce RTX 4090 Laptop GPU
specvp2020 creo-03 1080p + SPECviewperf 2020 v1 - specvp2020 creo-03 1080p
min: 113.27 avg: 128.6 median: 131 (77%) max: 138.99 fps
...
NVIDIA GeForce RTX 4090 Laptop GPU
...
specvp2020 catia-06 1080p + SPECviewperf 2020 v1 - specvp2020 catia-06 1080p
min: 17.84 avg: 90.2 median: 113.2 (87%) max: 116.64 fps
...
NVIDIA GeForce RTX 4090 Laptop GPU
specvp2020 3dsmax-07 1080p + SPECviewperf 2020 v1 - specvp2020 3dsmax-07 1080p
min: 128 avg: 188.5 median: 206.7 (97%) max: 212.6 fps
...
NVIDIA GeForce RTX 4090 Laptop GPU
...
specvp2020 solidworks-05 4k + SPECviewperf 2020 v1 - specvp2020 solidworks-05 4k
207.6 fps (61%)
...
NVIDIA GeForce RTX 4090 Laptop GPU
max:
specvp2020 snx-04 4k + SPECviewperf 2020 v1 - specvp2020 snx-04 4k
min: 27.3 avg: 29.4 median: 28.2 (3%) max: 32.8 fps
...
NVIDIA GeForce RTX 4090 Laptop GPU
...
max:
NVIDIA RTX 6000 Ada Generation
specvp2020 medical-03 4k + SPECviewperf 2020 v1 - specvp2020 medical-03 4k
min: 24.42 avg: 35.9 median: 27.3 (35%) max: 56 fps
...
NVIDIA GeForce RTX 4090 Laptop GPU
max:
NVIDIA RTX 6000 Ada Generation
specvp2020 maya-06 4k + SPECviewperf 2020 v1 - specvp2020 maya-06 4k
min: 269.8 avg: 371.9 median: 371.8 (61%) max: 474 fps
...
NVIDIA GeForce RTX 4090 Laptop GPU
...
max:
NVIDIA RTX 6000 Ada Generation
specvp2020 energy-03 4k + SPECviewperf 2020 v1 - specvp2020 energy-03 4k
min: 75 avg: 101.9 median: 112.3 (25%) max: 118.3 fps
...
NVIDIA GeForce RTX 4090 Laptop GPU
max:
NVIDIA RTX 6000 Ada Generation
specvp2020 creo-03 4k + SPECviewperf 2020 v1 - specvp2020 creo-03 4k
min: 110.8 avg: 120.1 median: 117.5 (62%) max: 132 fps
...
NVIDIA GeForce RTX 4090 Laptop GPU
...
max:
NVIDIA RTX 6000 Ada Generation
specvp2020 catia-06 4k + SPECviewperf 2020 v1 - specvp2020 catia-06 4k
min: 63.7 avg: 79.3 median: 65.2 (47%) max: 109 fps
...
NVIDIA GeForce RTX 4090 Laptop GPU
...
max:
NVIDIA RTX 6000 Ada Generation
specvp2020 3dsmax-07 4k + SPECviewperf 2020 v1 - specvp2020 3dsmax-07 4k
min: 76.6 avg: 141.1 median: 147.7 (62%) max: 199 fps
...
NVIDIA GeForce RTX 4090 Laptop GPU
...
max:
Cinebench R10 Cinebench R10 Shading (32bit) + Cinebench R10 - Cinebench R10 Shading (32bit)
min: 6822 avg: 16922 median: 16004 (11%) max: 24410 points
...
NVIDIA GeForce RTX 4090 Laptop GPU
Cinebench R11.5 Cinebench R11.5 OpenGL 64 Bit + Cinebench R11.5 - Cinebench R11.5 OpenGL 64 Bit
min: 182.2 avg: 199.5 median: 203.2 (70%) max: 208.27 fps
...
NVIDIA GeForce RTX 4090 Laptop GPU
...
max:
NVIDIA RTX 6000 Ada Generation
Cinebench R15 + Cinebench R15 - Cinebench R15 OpenGL 64 Bit
min: 174.3 avg: 276.8 median: 281 (16%) max: 351 fps
GPU TDP ? TDP 125 W TDP 150 W TDP 175 W 95% 61% 78% 100%
...
NVIDIA GeForce RTX 4090 Laptop GPU
max:
NVIDIA RTX 6000 Ada Generation
Cinebench R15 OpenGL Ref. Match 64 Bit + Cinebench R15 - Cinebench R15 OpenGL Ref. Match 64 Bit
99.6 % (100%)
GPU TDP ? TDP 125 W TDP 150 W TDP 175 W 100% 100% 100% 100%
...
NVIDIA GeForce RTX 4090 Laptop GPU
...
GFXBench - GFXBench 5.0 4K Aztec Ruins High Tier Offscreen
min: 239.5 avg: 242.8 median: 242.8 (99%) max: 246 fps
...
Apple M3 Max 40-Core GPU
NVIDIA GeForce RTX 4090 Laptop GPU
GFXBench - GFXBench 5.0 Aztec Ruins High Tier Offscreen
min: 522 avg: 536 median: 536 (97%) max: 550 fps
...
Apple M3 Max 40-Core GPU
NVIDIA GeForce RTX 4090 Laptop GPU
GFXBench - GFXBench 5.0 Aztec Ruins Normal Tier Offscreen
min: 1157 avg: 1254 median: 1253.5 (93%) max: 1350 fps
...
Apple M3 Max 40-Core GPU
NVIDIA GeForce RTX 4090 Laptop GPU
GFXBench - GFXBench Car Chase Offscreen
888 fps (100%)
...
Apple M3 Max 40-Core GPU
NVIDIA GeForce RTX 4090 Laptop GPU
GFXBench 3.1 - GFXBench Manhattan ES 3.1 Offscreen
993 fps (21%)
...
NVIDIA GeForce RTX 4090 Laptop GPU
Apple M3 Max 40-Core GPU
...
GFXBench 3.0 - GFXBench 3.0 Manhattan Offscreen
1057 fps (62%)
...
NVIDIA GeForce RTX 4090 Laptop GPU
Apple M3 Max 40-Core GPU
GFXBench (DX / GLBenchmark) 2.7 + GFXBench (DX / GLBenchmark) 2.7 - GFXBench T-Rex HD Offscreen C24Z16
4088 fps (33%)
...
Apple M3 Max 40-Core GPU
NVIDIA GeForce RTX 4090 Laptop GPU
...
Basemark GPU 1.2 - Basemark GPU 1.2 Vulkan Official Medium Offscreen 1080
min: 104.6 avg: 1370 median: 1746 (43%) max: 2544 fps
...
NVIDIA GeForce RTX 4090 Laptop GPU
...
max:
Basemark GPU 1.2 - Basemark GPU 1.2 Vulkan Official High Offscreen 2160
min: 3.64 avg: 4.9 median: 3.6 (1%) max: 9.73 fps
...
NVIDIA GeForce RTX 4090 Laptop GPU
...
Geekbench 6.2 - Geekbench 6.2 GPU OpenCL
min: 181225 avg: 193130 median: 192262 (56%) max: 205902 points
...
Apple M3 Max 40-Core GPU
NVIDIA GeForce RTX 4090 Laptop GPU
max:
NVIDIA RTX 6000 Ada Generation
Geekbench 6.2 - Geekbench 6.2 GPU Vulkan
min: 136811 avg: 150676 median: 157602 (51%) max: 157614 points
...
NVIDIA GeForce RTX 4090 Laptop GPU
max:
NVIDIA RTX 6000 Ada Generation
LuxMark v2.0 64Bit - LuxMark v2.0 Room GPU
min: 8614 avg: 8823 median: 8823 (40%) max: 9032 Samples/s
...
NVIDIA GeForce RTX 4090 Laptop GPU
max:
LuxMark v2.0 64Bit - LuxMark v2.0 Sala GPU
min: 19782 avg: 19892 median: 19891.5 (35%) max: 20001 Samples/s
...
NVIDIA GeForce RTX 4090 Laptop GPU
max:
ComputeMark v2.1 - ComputeMark v2.1 Result
min: 30767 avg: 44242 median: 49892 (54%) max: 52066 points
...
NVIDIA GeForce RTX 4090 Laptop GPU
...
max:
Power Consumption - Furmark Stress Test Power Consumption - external Monitor *
min: 126.7 avg: 227 median: 242 (34%) max: 264 Watt
GPU TDP 125 W TDP 150 W TDP 175 W 116% 111% 100%
...
NVIDIA GeForce RTX 4090 Laptop GPU
...
max:
0 20 40 60 80 100 120 140 160 180 200 220 240 260 280 300 Tooltip Lenovo Legion Pro 7 RTX4090: Ø126.7 (122.9-136.6)
Asus ROG Zephyrus G14 GA402XY: Ø160.1 (130.2-165.2)
Asus ROG Zephyrus M16 GU604VY-NM042X: Ø183.1 (177.16-188.37)
Asus ROG Strix Scar 18 2023 G834JY-N6005W: Ø217 (207-246)
MSI Titan GT77 HX 13VI: Ø218 (183.4-250)
Asus Zephyrus Duo 16 GX650PY-NM006W: Ø236 (219-250)
Razer Blade 16 Early 2023 RTX 4090: Ø239 (201-261)
Aorus 17X AZF: Ø239 (233-273)
SCHENKER Key 17 Pro (Early 23): Ø242 (231-250)
Asus ROG Strix Scar 17 G733PYV-LL053X: Ø242 (225-263)
Asus ROG Strix Scar 18 2023 G834JY-N6005W: Ø243 (229-316)
Medion Erazer Beast X40: Ø243 (231-254)
Eluktronics Mech-17 GP2: Ø244 (233-275)
SCHENKER XMG Neo 16 E23: Ø245 (225-282)
Lenovo Legion 9 16IRX8: Ø246 (233-261)
Asus ROG Strix Scar 17 G733PY-XS96: Ø248 (240-254)
Eurocom Raptor X17: Ø251 (239-271)
Alienware m18 R1: Ø264 (253-273)
Power Consumption - The Witcher 3 Power Consumption - external Monitor *
min: 159.1 avg: 260.2 median: 271 (38%) max: 307 Watt
GPU TDP 125 W TDP 150 W TDP 175 W 125% 116% 100%
...
NVIDIA GeForce RTX 4090 Laptop GPU
...
max:
0 20 40 60 80 100 120 140 160 180 200 220 240 260 280 300 320 Tooltip Asus ROG Zephyrus G14 GA402XY: Ø159.1 (155-163.2)
Asus ROG Zephyrus M16 GU604VY-NM042X: Ø197.2 (188.27-203.14)
Razer Blade 16 Early 2023 RTX 4090: Ø242 (232-257)
Asus ROG Strix Scar 18 2023 G834JY-N6005W: Ø244 (235-267)
Asus Zephyrus Duo 16 GX650PY-NM006W: Ø244 (232-252)
MSI Titan GT77 HX 13VI: Ø250 (245-260)
Lenovo Legion 9 16IRX8: Ø252 (243-269)
Asus ROG Strix Scar 17 G733PYV-LL053X: Ø257 (253-260)
SCHENKER Key 17 Pro (Early 23): Ø267 (229-292)
Asus ROG Strix Scar 17 G733PY-XS96: Ø275 (271-292)
Aorus 17X AZF: Ø276 (261-289)
Lenovo Legion Pro 7 RTX4090: Ø277 (257-293)
Medion Erazer Beast X40: Ø285 (269-318)
Eluktronics Mech-17 GP2: Ø286 (272-295)
Eurocom Raptor X17: Ø286 (279-299)
Asus ROG Strix Scar 18 2023 G834JY-N6005W: Ø289 (271-315)
SCHENKER XMG Neo 16 E23: Ø291 (266-318)
Alienware m18 R1: Ø307 (301-330)
Power Consumption - Witcher 3 Power Consumption *
min: 172 avg: 271 median: 278 (61%) max: 311 Watt
GPU TDP ? TDP 125 W TDP 150 W TDP 175 W 100% 194% 169% 120%
...
NVIDIA GeForce RTX 4090 Laptop GPU
0 20 40 60 80 100 120 140 160 180 200 220 240 260 280 300 320 Tooltip Asus ROG Zephyrus G14 GA402XY: Ø172 (167.7-177.9)
Asus ROG Zephyrus M16 GU604VY-NM042X: Ø209 (198.81-220.74)
Lenovo Legion 9 16IRX8: Ø254 (244-263)
Razer Blade 16 Early 2023 RTX 4090: Ø256 (245-271)
Asus Zephyrus Duo 16 GX650PY-NM006W: Ø258 (248-265)
Asus ROG Strix Scar 17 G733PYV-LL053X: Ø262 (260-266)
MSI Titan GT77 HX 13VI: Ø265 (259-273)
Aorus 17X AZF: Ø278 (267-296)
Asus ROG Strix Scar 17 G733PY-XS96: Ø278 (263-296)
Medion Erazer Beast X40: Ø280 (254-311)
Lenovo Legion Pro 7 RTX4090: Ø282 (186.2-315)
SCHENKER Key 17 Pro (Early 23): Ø292 (285-304)
SCHENKER XMG Neo 16 E23: Ø294 (270-323)
Eluktronics Mech-17 GP2: Ø304 (297-331)
Eurocom Raptor X17: Ø304 (292-311)
Eluktronics Mech-17 GP2 Liquid Propulsion Package G2: Ø309 (306-326)
Alienware m18 R1: Ø311 (305-332)
Power Consumption - GFXBench Aztec Ruins Normal Tier Offscreen Power Consumption 150cd *
259 Watt (100%)
NVIDIA GeForce RTX 4090 Laptop GPU
0 15 30 45 60 75 90 105 120 135 150 165 180 195 210 225 240 255 270 Tooltip Asus ROG Strix Scar 18 2023 G834JY-N6005W: Ø259 (186.5-272)
Power Consumption - Witcher 3 ultra Power Efficiency
min: 0.682 avg: 0.7 median: 0.7 (73%) max: 0.876 fps per Watt
GPU TDP 125 W TDP 150 W TDP 175 W 100% 98% 83%
...
Apple M3 Max 40-Core GPU
NVIDIA GeForce RTX 4090 Laptop GPU
Power Consumption - Witcher 3 ultra Power Efficiency - external Monitor
min: 0.722 avg: 0.8 median: 0.7 (62%) max: 0.947 fps per Watt
GPU TDP 125 W TDP 150 W TDP 175 W 100% 95% 80%
...
Apple M3 Max 40-Core GPU
NVIDIA GeForce RTX 4090 Laptop GPU
Clock Speed - GPU Clock Witcher 3 ultra
min: 2130 avg: 2170 median: 2145 (84%) max: 2235 MHz
...
NVIDIA GeForce RTX 4090 Laptop GPU
- Range of benchmark values for this graphics card
- Average benchmark values for this graphics card
* Smaller numbers mean a higher performance
Game Benchmarks The following benchmarks stem from our benchmarks of review laptops. The performance depends on the used graphics memory, clock rate, processor, system settings, drivers, and operating systems. So the results don't have to be representative for all laptops with this GPU. For detailed information on the benchmark results, click on the fps number.
NVIDIA GeForce RTX 4090 Laptop GPU
Maximum value not found for - , could not paint bar!
NVIDIA GeForce RTX 4090 Laptop GPU
Maximum value not found for - , could not paint bar!
NVIDIA GeForce RTX 4090 Laptop GPU
Maximum value not found for - , could not paint bar!
NVIDIA GeForce RTX 4090 Laptop GPU
Maximum value not found for - , could not paint bar!
NVIDIA GeForce RTX 4090 Laptop GPU
Maximum value not found for - , could not paint bar!
» With all tested laptops playable in detail settings ultra.
Additional Benchmarks
Extreme Preset + Quality DLSS 3840x2160
101 [X] XMG Neo 17 E23 Intel Core i9-13900HX 1.6GHz
NVIDIA GeForce RTX 4090 Laptop GPU
min:
73 fps
0 100 Tooltip : Ø136.3 (116.831-149.89)
...
NVIDIA GeForce RTX 4090 Laptop GPU
max:
...
NVIDIA GeForce RTX 4090 Laptop GPU
max:
...
NVIDIA GeForce RTX 4090 Laptop GPU
max:
NVIDIA GeForce RTX 4090 Laptop GPU
max:
NVIDIA GeForce RTX 4090 Laptop GPU
max:
» With all tested laptops playable in detail settings high.
Additional Benchmarks
High Preset + High Ray Tracing 1920x1080
70.3 [X] XMG Neo 17 E23 Intel Core i9-13900HX 1.6GHz
NVIDIA GeForce RTX 4090 Laptop GPU
min:
41.9 fps, P0.1:
43 fps, P1:
53.4 fps, max:
99 fps
High Preset + High Ray Tracing + Quality DLSS + FG 3840x2160
63 [X] XMG Neo 17 E23 Intel Core i9-13900HX 1.6GHz
NVIDIA GeForce RTX 4090 Laptop GPU
min:
36.3 fps, P0.1:
42.6 fps, P1:
48.4 fps, max:
75.3 fps
...
NVIDIA GeForce RTX 4090 Laptop GPU
max:
...
NVIDIA GeForce RTX 4090 Laptop GPU
max:
...
NVIDIA GeForce RTX 4090 Laptop GPU
max:
NVIDIA GeForce RTX 4090 Laptop GPU
max:
NVIDIA GeForce RTX 4090 Laptop GPU
max:
» With all tested laptops playable in detail settings ultra.
Additional Benchmarks
Ultra Preset + DLSS Quality 3840x2160
49.9 [X] XMG Neo 17 E23 Intel Core i9-13900HX 1.6GHz
NVIDIA GeForce RTX 4090 Laptop GPU
min:
0.878 fps, P0.1:
1.651 fps, P1:
23.2 fps, max:
713 fps
...
Apple M3 Max 40-Core GPU
NVIDIA GeForce RTX 4090 Laptop GPU
max:
...
Apple M3 Max 40-Core GPU
NVIDIA GeForce RTX 4090 Laptop GPU
max:
...
Apple M3 Max 40-Core GPU
NVIDIA GeForce RTX 4090 Laptop GPU
max:
...
Apple M3 Max 40-Core GPU
NVIDIA GeForce RTX 4090 Laptop GPU
max:
NVIDIA GeForce RTX 4090 Laptop GPU
max:
» With all tested laptops playable in detail settings ultra.
...
NVIDIA GeForce RTX 4090 Laptop GPU
max:
...
NVIDIA GeForce RTX 4090 Laptop GPU
max:
147 [X] XMG Neo 17 E23 Intel Core i9-13900HX 1.6GHz
NVIDIA GeForce RTX 4090 Laptop GPU
min:
9 fps
149 [X] MSI Raider GE78 HX 13VI Intel Core i9-13980HX 1.6GHz
NVIDIA GeForce RTX 4090 Laptop GPU
min:
5 fps, max:
191 fps
~ 148 fps
+ Compare
- Hide Comparison
...
NVIDIA GeForce RTX 4090 Laptop GPU
max:
127 [X] MSI Raider GE78 HX 13VI Intel Core i9-13980HX 1.6GHz
NVIDIA GeForce RTX 4090 Laptop GPU
min:
5 fps, max:
177 fps
129 [X] XMG Neo 17 E23 Intel Core i9-13900HX 1.6GHz
NVIDIA GeForce RTX 4090 Laptop GPU
min:
5 fps
~ 128 fps
+ Compare
- Hide Comparison
...
NVIDIA GeForce RTX 4090 Laptop GPU
max:
80 [X] XMG Neo 17 E23 Intel Core i9-13900HX 1.6GHz
NVIDIA GeForce RTX 4090 Laptop GPU
min:
12 fps
80 [X] MSI Raider GE78 HX 13VI Intel Core i9-13980HX 1.6GHz
NVIDIA GeForce RTX 4090 Laptop GPU
min:
5 fps, max:
155 fps
~ 80 fps
+ Compare
- Hide Comparison
NVIDIA GeForce RTX 4090 Laptop GPU
max:
» With all tested laptops playable in detail settings ultra.
Additional Benchmarks
Ultra High Preset (Adaptive Quality Off) + DLSS Quality 3840x2160
107 [X] XMG Neo 17 E23 Intel Core i9-13900HX 1.6GHz
NVIDIA GeForce RTX 4090 Laptop GPU
min:
11 fps
...
NVIDIA GeForce RTX 4090 Laptop GPU
max:
...
NVIDIA GeForce RTX 4090 Laptop GPU
max:
0 100 200 300 400 500 600 700 800 900 1000 1100 1200 1300 1400 1500 1600 1700 1800 1900 2000 2100 2200 2300 2400 2500 2600 2700 2800 2900 3000 3100 3200 3300 3400 3500 3600 3700 3800 3900 4000 4100 4200 4300 4400 4500 4600 4700 4800 4900 Tooltip
...
NVIDIA GeForce RTX 4090 Laptop GPU
...
max:
0 100 Tooltip : Ø170.7 (153.588-197.25)
NVIDIA GeForce RTX 4090 Laptop GPU
max:
NVIDIA GeForce RTX 4090 Laptop GPU
max:
» With all tested laptops playable in detail settings ultra.
NVIDIA GeForce RTX 4090 Laptop GPU
max:
NVIDIA GeForce RTX 4090 Laptop GPU
max:
NVIDIA GeForce RTX 4090 Laptop GPU
max:
NVIDIA GeForce RTX 4090 Laptop GPU
max:
NVIDIA GeForce RTX 4090 Laptop GPU
max:
» With all tested laptops playable in detail settings ultra.
...
NVIDIA GeForce RTX 4090 Laptop GPU
max:
...
NVIDIA GeForce RTX 4090 Laptop GPU
max:
119 [X] XMG Neo 17 E23 Intel Core i9-13900HX 1.6GHz
NVIDIA GeForce RTX 4090 Laptop GPU
min:
22 fps
127 [X] MSI Raider GE78 HX 13VI Intel Core i9-13980HX 1.6GHz
NVIDIA GeForce RTX 4090 Laptop GPU
min:
36.47 fps, max:
176.24 fps
~ 123 fps
+ Compare
- Hide Comparison
...
NVIDIA GeForce RTX 4090 Laptop GPU
max:
98.1 [X] XMG Neo 17 E23 Intel Core i9-13900HX 1.6GHz
NVIDIA GeForce RTX 4090 Laptop GPU
min:
22 fps
103.9 [X] MSI Raider GE78 HX 13VI Intel Core i9-13980HX 1.6GHz
NVIDIA GeForce RTX 4090 Laptop GPU
min:
39.09 fps, max:
148.62 fps
~ 101 fps
+ Compare
- Hide Comparison
...
Apple M3 Max 40-Core GPU
NVIDIA GeForce RTX 4090 Laptop GPU
max:
48.6 [X] XMG Neo 17 E23 Intel Core i9-13900HX 1.6GHz
NVIDIA GeForce RTX 4090 Laptop GPU
min:
40 fps
50.6 [X] MSI Raider GE78 HX 13VI Intel Core i9-13980HX 1.6GHz
NVIDIA GeForce RTX 4090 Laptop GPU
~ 50 fps
+ Compare
- Hide Comparison
NVIDIA GeForce RTX 4090 Laptop GPU
max:
» With all tested laptops playable in detail settings ultra.
Additional Benchmarks
Ray Tracing Ultra Preset (DLSS off) 1920x1080
70.2 [X] XMG Neo 17 E23 Intel Core i9-13900HX 1.6GHz
NVIDIA GeForce RTX 4090 Laptop GPU
min:
32 fps
75.5 [X] MSI Raider GE78 HX 13VI Intel Core i9-13980HX 1.6GHz
NVIDIA GeForce RTX 4090 Laptop GPU
min:
25.37 fps, max:
106.21 fps
Ray Tracing Ultra Preset + DLSS Quality + FG 3840x2160
63.8 [X] XMG Neo 17 E23 Intel Core i9-13900HX 1.6GHz
NVIDIA GeForce RTX 4090 Laptop GPU
min:
54 fps
62.9 [X] MSI Raider GE78 HX 13VI Intel Core i9-13980HX 1.6GHz
NVIDIA GeForce RTX 4090 Laptop GPU
min:
51.13 fps, max:
78.19 fps
...
NVIDIA GeForce RTX 4090 Laptop GPU
max:
...
NVIDIA GeForce RTX 4090 Laptop GPU
max:
...
NVIDIA GeForce RTX 4090 Laptop GPU
max:
NVIDIA GeForce RTX 4090 Laptop GPU
max:
NVIDIA GeForce RTX 4090 Laptop GPU
max:
» With all tested laptops playable in detail settings ultra.
Additional Benchmarks
Best Preset + DLSS Quality 3840x2160
137.3 [X] XMG Neo 17 E23 Intel Core i9-13900HX 1.6GHz
NVIDIA GeForce RTX 4090 Laptop GPU
min:
75.2 fps, P0.1:
83.1 fps, P1:
91.7 fps, max:
276 fps
NVIDIA GeForce RTX 4090 Laptop GPU
...
max:
NVIDIA GeForce RTX 4090 Laptop GPU
...
max:
NVIDIA GeForce RTX 4090 Laptop GPU
...
max:
NVIDIA GeForce RTX 4090 Laptop GPU
max:
NVIDIA GeForce RTX 4090 Laptop GPU
max:
» With all tested laptops playable in detail settings ultra.
...
NVIDIA GeForce RTX 4090 Laptop GPU
max:
...
NVIDIA GeForce RTX 4090 Laptop GPU
max:
...
NVIDIA GeForce RTX 4090 Laptop GPU
max:
...
NVIDIA GeForce RTX 4090 Laptop GPU
max:
...
NVIDIA GeForce RTX 4090 Laptop GPU
max:
» With all tested laptops playable in detail settings ultra.
0 100 200 300 400 500 600 700 800 900 1000 1100 1200 1300 1400 1500 1600 1700 1800 1900 2000 2100 2200 2300 2400 2500 2600 2700 2800 2900 3000 3100 3200 3300 3400 3500 3600 3700 3800 3900 4000 4100 4200 4300 4400 4500 4600 4700 4800 4900 Tooltip
...
NVIDIA GeForce RTX 4090 Laptop GPU
max:
...
NVIDIA GeForce RTX 4090 Laptop GPU
max:
...
NVIDIA GeForce RTX 4090 Laptop GPU
max:
...
NVIDIA GeForce RTX 4090 Laptop GPU
max:
...
NVIDIA GeForce RTX 4090 Laptop GPU
max:
» With all tested laptops playable in detail settings ultra.
...
NVIDIA GeForce RTX 4090 Laptop GPU
max:
...
NVIDIA GeForce RTX 4090 Laptop GPU
max:
NVIDIA GeForce RTX 4090 Laptop GPU
max:
0 100 200 300 400 500 600 700 Tooltip
NVIDIA GeForce RTX 4090 Laptop GPU
max:
» With all tested laptops playable in detail settings ultra.
Additional Benchmarks
Ultra + Quality DLSS + FG 16xAF 3840x2160
76.2 [X] XMG Neo 17 E23 Intel Core i9-13900HX 1.6GHz
NVIDIA GeForce RTX 4090 Laptop GPU
min:
18.4 fps, P0.1:
46.2 fps, P1:
58.9 fps, max:
117.9 fps
...
NVIDIA GeForce RTX 4090 Laptop GPU
max:
...
NVIDIA GeForce RTX 4090 Laptop GPU
max:
...
NVIDIA GeForce RTX 4090 Laptop GPU
max:
...
NVIDIA GeForce RTX 4090 Laptop GPU
max:
NVIDIA GeForce RTX 4090 Laptop GPU
max:
» With all tested laptops playable in detail settings ultra.
...
NVIDIA GeForce RTX 4090 Laptop GPU
max:
...
NVIDIA GeForce RTX 4090 Laptop GPU
max:
...
NVIDIA GeForce RTX 4090 Laptop GPU
max:
...
NVIDIA GeForce RTX 4090 Laptop GPU
max:
...
NVIDIA GeForce RTX 4090 Laptop GPU
max:
» With all tested laptops playable in detail settings ultra.
Additional Benchmarks
Ultra Preset + Quality DLSS 3840x2160
108.2 [X] XMG Neo 17 E23 Intel Core i9-13900HX 1.6GHz
NVIDIA GeForce RTX 4090 Laptop GPU
min:
39 fps, P0.1:
66 fps, P1:
92 fps, max:
274 fps
...
NVIDIA GeForce RTX 4090 Laptop GPU
max:
...
NVIDIA GeForce RTX 4090 Laptop GPU
max:
...
NVIDIA GeForce RTX 4090 Laptop GPU
max:
...
NVIDIA GeForce RTX 4090 Laptop GPU
max:
...
NVIDIA GeForce RTX 4090 Laptop GPU
max:
...
NVIDIA GeForce RTX 4090 Laptop GPU
max:
» With all tested laptops playable in detail settings ultra.
Additional Benchmarks
Very High Preset + Very High Raytracing TAA 1920x1080
90.9 [X] XMG Neo 17 E23 Intel Core i9-13900HX 1.6GHz
NVIDIA GeForce RTX 4090 Laptop GPU
min:
1.445 fps, P0.1:
39.1 fps, P1:
56.8 fps, max:
134.2 fps
Very High Preset + Very High Raytracing + DLSS Quality + FG 3840x2160
84.4 [X] XMG Neo 17 E23 Intel Core i9-13900HX 1.6GHz
NVIDIA GeForce RTX 4090 Laptop GPU
min:
32 fps, P0.1:
35.8 fps, P1:
47.5 fps, max:
142.7 fps
315 [X] MSI Raider GE78 HX 13VI 1038401
Intel Core i9-13980HX 1.6GHz
NVIDIA GeForce RTX 4090 Laptop GPU
min:
252 fps, P1:
196 fps, max:
361 fps
fps
+ Compare
- Hide Comparison
...
NVIDIA GeForce RTX 4090 Laptop GPU
max:
AMD Radeon RX 7800 XT
283 [X] XMG Neo 17 E23 Intel Core i9-13900HX 1.6GHz
NVIDIA GeForce RTX 4090 Laptop GPU
min:
94 fps
326 [X] MSI Raider GE78 HX 13VI 1038401
Intel Core i9-13980HX 1.6GHz
NVIDIA GeForce RTX 4090 Laptop GPU
min:
242 fps, P1:
212 fps, max:
363 fps
~ 305 fps
+ Compare
- Hide Comparison
...
NVIDIA GeForce RTX 4090 Laptop GPU
max:
274 [X] XMG Neo 17 E23 Intel Core i9-13900HX 1.6GHz
NVIDIA GeForce RTX 4090 Laptop GPU
min:
187 fps
312 [X] MSI Raider GE78 HX 13VI 1038401
Intel Core i9-13980HX 1.6GHz
NVIDIA GeForce RTX 4090 Laptop GPU
min:
232 fps, P1:
208 fps, max:
345 fps
374 ~ 320 fps
+ Compare
- Hide Comparison
...
NVIDIA GeForce RTX 4090 Laptop GPU
max:
116 [X] XMG Neo 17 E23 Intel Core i9-13900HX 1.6GHz
NVIDIA GeForce RTX 4090 Laptop GPU
min:
97 fps
129.8 [X] MSI Raider GE78 HX 13VI 1038401
Intel Core i9-13980HX 1.6GHz
NVIDIA GeForce RTX 4090 Laptop GPU
min:
104 fps, P1:
98 fps, max:
151 fps
132 ~ 126 fps
+ Compare
- Hide Comparison
...
NVIDIA GeForce RTX 4090 Laptop GPU
max:
80 [X] XMG Neo 17 E23 Intel Core i9-13900HX 1.6GHz
NVIDIA GeForce RTX 4090 Laptop GPU
min:
63 fps
81.9 [X] MSI Raider GE78 HX 13VI 1038401
Intel Core i9-13980HX 1.6GHz
NVIDIA GeForce RTX 4090 Laptop GPU
min:
65 fps, P1:
63 fps, max:
97 fps
85.1 ~ 82 fps
+ Compare
- Hide Comparison
...
NVIDIA GeForce RTX 4090 Laptop GPU
max:
40 [X] XMG Neo 17 E23 Intel Core i9-13900HX 1.6GHz
NVIDIA GeForce RTX 4090 Laptop GPU
min:
31 fps
42.2 76.1 [X] MSI Raider GE78 HX 13VI 1038401
Intel Core i9-13980HX 1.6GHz
NVIDIA GeForce RTX 4090 Laptop GPU
min:
60 fps, P1:
59 fps, max:
89 fps
~ 53 fps
+ Compare
- Hide Comparison
...
NVIDIA GeForce RTX 4090 Laptop GPU
max:
» With all tested laptops playable in detail settings ultra.
Additional Benchmarks
Ultra Low Preset TAA 1280x720
292 [X] MSI Raider GE78 HX 13VI Intel Core i9-13980HX 1.6GHz
NVIDIA GeForce RTX 4090 Laptop GPU
min:
220 fps, P1:
133 fps, max:
372 fps
Ultra High Preset + DLSS Quality (+ FG) 16xAF 3840x2160
66 [X] XMG Neo 17 E23 Intel Core i9-13900HX 1.6GHz
NVIDIA GeForce RTX 4090 Laptop GPU
min:
53 fps
...
NVIDIA GeForce RTX 4090 Laptop GPU
max:
...
NVIDIA GeForce RTX 4090 Laptop GPU
max:
...
NVIDIA GeForce RTX 4090 Laptop GPU
max:
...
NVIDIA GeForce RTX 4090 Laptop GPU
max:
...
NVIDIA GeForce RTX 4090 Laptop GPU
max:
...
NVIDIA GeForce RTX 4090 Laptop GPU
max:
» With all tested laptops playable in detail settings ultra.
Additional Benchmarks
Ultra Preset + DLSS Quality + FG 3840x2160
167.2 [X] XMG Neo 17 E23 Intel Core i9-13900HX 1.6GHz
NVIDIA GeForce RTX 4090 Laptop GPU
min:
66.4 fps, P0.1:
130.6 fps, P1:
151 fps, max:
201 fps
0 100 Tooltip Key 17 Pro (Early 23): Ø136.6 (109.655-185.5)
...
NVIDIA GeForce RTX 4090 Laptop GPU
max:
0 100 Tooltip : Ø117.9 (97.012-175)
Key 17 Pro (Early 23): Ø131.1 (110.096-152.24)
...
NVIDIA GeForce RTX 4090 Laptop GPU
max:
0 100 200 300 400 500 Tooltip : Ø124.5 (99.347-504)
Key 17 Pro (Early 23): Ø124.9 (105.464-155.2)
...
NVIDIA GeForce RTX 4090 Laptop GPU
...
max:
0 100 200 Tooltip : Ø111.1 (72.498-121.4)
Key 17 Pro (Early 23): Ø124.4 (92.124-272.7)
...
NVIDIA GeForce RTX 4090 Laptop GPU
max:
0 100 200 Tooltip : Ø91.2 (68.459-250.4)
Key 17 Pro (Early 23): Ø88.8 (68.105-138.2)
...
NVIDIA GeForce RTX 4090 Laptop GPU
...
max:
0 100 200 Tooltip Key 17 Pro (Early 23): Ø51.2 (37.08-282)
: Ø45.7 (34.8-116.3)
...
NVIDIA GeForce RTX 4090 Laptop GPU
max:
» With all tested laptops playable in detail settings ultra.
Additional Benchmarks
Epic Preset + Ray Tracing 1920x1080
80.5 [X] XMG Neo 17 E23 Intel Core i9-13900HX 1.6GHz
NVIDIA GeForce RTX 4090 Laptop GPU
min:
6.02 fps, P0.1:
10.5 fps, P1:
33.2 fps, max:
117 fps
0 100 200 Tooltip Key 17 Pro (Early 23): Ø228 (100.394-281.56)
...
NVIDIA GeForce RTX 4090 Laptop GPU
max:
0 100 200 Tooltip Key 17 Pro (Early 23): Ø211 (171.073-259.24)
: Ø225 (191.75-276.95)
...
NVIDIA GeForce RTX 4090 Laptop GPU
...
max:
0 100 200 Tooltip Key 17 Pro (Early 23): Ø192.1 (139.97-231.151)
: Ø211 (163.461-266.6)
...
NVIDIA GeForce RTX 4090 Laptop GPU
max:
0 100 200 Tooltip Key 17 Pro (Early 23): Ø191.6 (146.434-263.4)
: Ø207 (158.151-250.98)
...
NVIDIA GeForce RTX 4090 Laptop GPU
max:
0 100 200 Tooltip Key 17 Pro (Early 23): Ø187.3 (147.234-291.8)
: Ø201 (152.036-228.7)
NVIDIA GeForce RTX 4090 Laptop GPU
max:
0 100 Tooltip Key 17 Pro (Early 23): Ø99.8 (84.29-140.3)
: Ø102.9 (92.769-115.676)
NVIDIA GeForce RTX 4090 Laptop GPU
max:
» With all tested laptops playable in detail settings ultra.
0 100 Tooltip 17X AZF: Ø117.7 (76.971-174.5)
...
NVIDIA GeForce RTX 4090 Laptop GPU
max:
0 100 Tooltip 17X AZF: Ø115 (77.007-181.9)
...
NVIDIA GeForce RTX 4090 Laptop GPU
max:
0 100 Tooltip 17X AZF: Ø111.4 (75.066-141.69)
...
NVIDIA GeForce RTX 4090 Laptop GPU
max:
0 100 200 300 400 500 600 Tooltip 17X AZF: Ø115.2 (72.14-616)
...
NVIDIA GeForce RTX 4090 Laptop GPU
max:
0 100 Tooltip 17X AZF: Ø85 (70.068-123.7)
NVIDIA GeForce RTX 4090 Laptop GPU
...
max:
0 Tooltip 17X AZF: Ø47.8 (35.269-84)
NVIDIA GeForce RTX 4090 Laptop GPU
max:
» With all tested laptops playable in detail settings ultra.
Additional Benchmarks
Low Preset 1280x720
112.3 [X] Aorus 17X AZF Intel Core i9-13900HX 1.6GHz
NVIDIA GeForce RTX 4090 Laptop GPU
min:
33.8 fps, P0.1:
47.8 fps, P1:
65.3 fps, max:
292 fps
Ultra Preset + Quality DLSS 3840x2160
0 100 200 Tooltip Key 17 Pro (Early 23): Ø208 (175.16-248.2)
17X AZF: Ø235 (169.73-268.9)
...
NVIDIA GeForce RTX 4090 Laptop GPU
max:
0 100 200 300 400 Tooltip 17X AZF: Ø192.6 (156.06-209.338)
Key 17 Pro (Early 23): Ø208 (163.071-416)
...
NVIDIA GeForce RTX 4090 Laptop GPU
max:
0 100 200 300 400 Tooltip Key 17 Pro (Early 23): Ø183.5 (116.24-404)
17X AZF: Ø196.4 (169.52-341.6)
...
NVIDIA GeForce RTX 4090 Laptop GPU
max:
0 100 200 Tooltip 17X AZF: Ø138.7 (112.71-157.68)
Key 17 Pro (Early 23): Ø149.6 (111.509-209.5)
...
NVIDIA GeForce RTX 4090 Laptop GPU
max:
0 100 200 Tooltip 17X AZF: Ø111.9 (91.193-146.5)
Key 17 Pro (Early 23): Ø121.3 (107.429-269.3)
...
NVIDIA GeForce RTX 4090 Laptop GPU
max:
0 100 Tooltip 17X AZF: Ø71.2 (56.147-158.7)
Key 17 Pro (Early 23): Ø67 (59.264-98.8)
NVIDIA GeForce RTX 4090 Laptop GPU
max:
» With all tested laptops playable in detail settings ultra.
Additional Benchmarks
Prioritize Performance Preset 1280x720
245 [X] Aorus 17X AZF Intel Core i9-13900HX 1.6GHz
NVIDIA GeForce RTX 4090 Laptop GPU
min:
4.89 fps, P0.1:
67.8 fps, P1:
156.5 fps, max:
353 fps
...
NVIDIA GeForce RTX 4090 Laptop GPU
max:
...
NVIDIA GeForce RTX 4090 Laptop GPU
max:
...
NVIDIA GeForce RTX 4090 Laptop GPU
max:
...
NVIDIA GeForce RTX 4090 Laptop GPU
max:
...
NVIDIA GeForce RTX 4090 Laptop GPU
max:
...
NVIDIA GeForce RTX 4090 Laptop GPU
max:
» With all tested laptops playable in detail settings ultra.
Additional Benchmarks
Minimum Settings 1280x720
0 100 200 300 400 500 600 700 800 900 1000 1100 1200 1300 Tooltip Erazer Beast X40: Ø144.9 (77.52-1329)
Key 17 Pro (Early 23): Ø108.6 (95.023-252.5)
...
NVIDIA GeForce RTX 4090 Laptop GPU
...
max:
0 100 Tooltip Erazer Beast X40: Ø96.8 (80.969-199.5)
Key 17 Pro (Early 23): Ø99.8 (89.107-121.1)
...
NVIDIA GeForce RTX 4090 Laptop GPU
max:
0 100 Tooltip Erazer Beast X40: Ø94.4 (80.527-144.2)
Key 17 Pro (Early 23): Ø98.9 (86.196-138)
...
NVIDIA GeForce RTX 4090 Laptop GPU
max:
0 100 Tooltip Erazer Beast X40: Ø93.4 (79.232-169.1)
Key 17 Pro (Early 23): Ø99.9 (85.045-186.9)
...
NVIDIA GeForce RTX 4090 Laptop GPU
max:
0 100 200 Tooltip Erazer Beast X40: Ø94.4 (78.007-216.3)
Key 17 Pro (Early 23): Ø93.4 (81.071-119.4)
...
NVIDIA GeForce RTX 4090 Laptop GPU
max:
0 100 Tooltip Key 17 Pro (Early 23): Ø76.5 (62.005-119.3)
NVIDIA GeForce RTX 4090 Laptop GPU
max:
» With all tested laptops playable in detail settings ultra.
Additional Benchmarks
Ultra Low Preset 1280x720
101.5 [X] Medion Erazer Beast X40 Intel Core i9-13900HX 1.6GHz
NVIDIA GeForce RTX 4090 Laptop GPU
min:
35.6 fps, P0.1:
69.1 fps, P1:
75.6 fps, max:
163.4 fps
0 100 200 Tooltip Erazer Beast X40: Ø208 (184.337-250.9)
17X AZF: Ø220 (201.108-246.4)
...
NVIDIA GeForce RTX 4090 Laptop GPU
max:
0 100 200 300 400 500 Tooltip Erazer Beast X40: Ø170.4 (154.206-517)
17X AZF: Ø192.9 (173.183-286.1)
...
NVIDIA GeForce RTX 4090 Laptop GPU
...
max:
0 100 200 300 Tooltip Erazer Beast X40: Ø151.9 (127.524-385)
17X AZF: Ø172.5 (155.985-275.6)
...
NVIDIA GeForce RTX 4090 Laptop GPU
max:
0 100 200 Tooltip Erazer Beast X40: Ø133.2 (122.358-166.1)
17X AZF: Ø143.2 (127.63-213.8)
...
NVIDIA GeForce RTX 4090 Laptop GPU
max:
0 100 200 300 400 500 600 700 800 900 1000 1100 1200 1300 1400 1500 1600 1700 1800 1900 2000 2100 2200 2300 2400 2500 Tooltip Erazer Beast X40: Ø146.7 (87.139-2513)
17X AZF: Ø111.9 (100.021-189.6)
...
NVIDIA GeForce RTX 4090 Laptop GPU
max:
0 100 200 300 400 Tooltip 17X AZF: Ø75.2 (58.173-423)
NVIDIA GeForce RTX 4090 Laptop GPU
max:
» With all tested laptops playable in detail settings ultra.
Additional Benchmarks
Low Preset 1280x720
216 [X] Medion Erazer Beast X40 Intel Core i9-13900HX 1.6GHz
NVIDIA GeForce RTX 4090 Laptop GPU
min:
72 fps, P0.1:
144.4 fps, P1:
176.5 fps, max:
253 fps
226 [X] Aorus 17X AZF Intel Core i9-13900HX 1.6GHz
NVIDIA GeForce RTX 4090 Laptop GPU
min:
83 fps, P0.1:
158.4 fps, P1:
184.4 fps, max:
281 fps
...
NVIDIA GeForce RTX 4090 Laptop GPU
max:
...
NVIDIA GeForce RTX 4090 Laptop GPU
max:
...
NVIDIA GeForce RTX 4090 Laptop GPU
max:
...
NVIDIA GeForce RTX 4090 Laptop GPU
max:
...
NVIDIA GeForce RTX 4090 Laptop GPU
max:
...
NVIDIA GeForce RTX 4090 Laptop GPU
max:
» With all tested laptops playable in detail settings ultra.
Additional Benchmarks
Low Preset 1280x720
Epic Preset + Epic Ray-Tracing 1920x1080
Epic Preset + Epic Ray-Tracing 3840x2160
0 100 200 Tooltip 17X AZF: Ø125.4 (102.029-290.3)
Erazer Beast X40: Ø243 (168.1-285.06)
...
NVIDIA GeForce RTX 4090 Laptop GPU
max:
AMD Radeon RX 7800 XT
0 100 200 Tooltip 17X AZF: Ø102.7 (71.211-121.4)
Erazer Beast X40: Ø208 (167.28-259.7)
...
NVIDIA GeForce RTX 4090 Laptop GPU
max:
0 100 200 300 Tooltip 17X AZF: Ø98.4 (65.177-199.1)
Erazer Beast X40: Ø196.2 (171.237-342.8)
...
NVIDIA GeForce RTX 4090 Laptop GPU
max:
0 100 200 Tooltip 17X AZF: Ø103.5 (57.15-298.8)
Erazer Beast X40: Ø167.9 (116.84-188.73)
...
NVIDIA GeForce RTX 4090 Laptop GPU
max:
0 100 Tooltip 17X AZF: Ø86.2 (60.82-176.7)
Erazer Beast X40: Ø129.1 (112.581-148)
...
NVIDIA GeForce RTX 4090 Laptop GPU
max:
0 Tooltip 17X AZF: Ø53.9 (44.966-73.6)
...
NVIDIA GeForce RTX 4090 Laptop GPU
max:
» With all tested laptops playable in detail settings ultra.
Additional Benchmarks
Low Preset Low TAA 1280x720
245 [X] Medion Erazer Beast X40 Intel Core i9-13900HX 1.6GHz
NVIDIA GeForce RTX 4090 Laptop GPU
min:
54.8 fps, P0.1:
126.6 fps, P1:
177.3 fps, max:
1516 fps
124.4 [X] Aorus 17X AZF Intel Core i9-13900HX 1.6GHz
NVIDIA GeForce RTX 4090 Laptop GPU
min:
25.4 fps, P0.1:
77.7 fps, P1:
95.6 fps, max:
154.8 fps
Ultra Preset + Full Ray Tracing High TAA 1920x1080
65.5 [X] Medion Erazer Beast X40 Intel Core i9-13900HX 1.6GHz
NVIDIA GeForce RTX 4090 Laptop GPU
min:
24.6 fps, P0.1:
27.1 fps, P1:
39.9 fps, max:
90.3 fps
67 [X] Aorus 17X AZF Intel Core i9-13900HX 1.6GHz
NVIDIA GeForce RTX 4090 Laptop GPU
min:
20.2 fps, P0.1:
24.5 fps, P1:
32.4 fps, max:
90.9 fps
Ultra Preset + Full Ray Tracing High TAA 3840x2160
31.1 [X] Aorus 17X AZF Intel Core i9-13900HX 1.6GHz
NVIDIA GeForce RTX 4090 Laptop GPU
min:
15.4 fps, P0.1:
17.1 fps, P1:
19.9 fps, max:
85.4 fps
0 100 Tooltip 17X AZF: Ø155.2 (125.67-171.59)
...
NVIDIA GeForce RTX 4090 Laptop GPU
max:
0 100 200 Tooltip 17X AZF: Ø155.9 (118.28-200.6)
...
NVIDIA GeForce RTX 4090 Laptop GPU
max:
0 100 200 Tooltip 17X AZF: Ø146.6 (109.137-219.6)
...
NVIDIA GeForce RTX 4090 Laptop GPU
max:
0 100 Tooltip 17X AZF: Ø142.2 (109.615-159.631)
...
NVIDIA GeForce RTX 4090 Laptop GPU
max:
0 100 Tooltip 17X AZF: Ø109.3 (88.13-136.3)
...
NVIDIA GeForce RTX 4090 Laptop GPU
max:
0 100 Tooltip 17X AZF: Ø63.7 (50.392-139)
...
NVIDIA GeForce RTX 4090 Laptop GPU
max:
» With all tested laptops playable in detail settings ultra.
Additional Benchmarks
Low Preset TAA 1280x720
164 [X] Aorus 17X AZF Intel Core i9-13900HX 1.6GHz
NVIDIA GeForce RTX 4090 Laptop GPU
min:
20.1 fps, P0.1:
35.2 fps, P1:
46.9 fps, max:
513 fps
0 100 200 Tooltip Blade 16 Early 2023 RTX 4090: Ø223 (194.36-262.117)
...
NVIDIA GeForce RTX 4090 Laptop GPU
...
max:
0 100 Tooltip Blade 16 Early 2023 RTX 4090: Ø157 (142.148-172.7)
...
NVIDIA GeForce RTX 4090 Laptop GPU
max:
0 100 200 300 Tooltip Blade 16 Early 2023 RTX 4090: Ø145.6 (127.293-329.3)
...
NVIDIA GeForce RTX 4090 Laptop GPU
max:
AMD Radeon RX 7800 XT
0 100 200 300 Tooltip Blade 16 Early 2023 RTX 4090: Ø125.4 (109.072-160.5)
ROG Strix Scar 18 2023 G834JY-N6005W: Ø145.8 (121.141-343)
...
NVIDIA GeForce RTX 4090 Laptop GPU
max:
AMD Radeon RX 7800 XT
0 100 200 Tooltip Blade 16 Early 2023 RTX 4090: Ø90.6 (76.255-242.7)
ROG Strix Scar 18 2023 G834JY-N6005W: Ø102.8 (90.39-190.4)
...
NVIDIA GeForce RTX 4090 Laptop GPU
max:
NVIDIA RTX 6000 Ada Generation
0 Tooltip Blade 16 Early 2023 RTX 4090: Ø43.5 (34.894-51.8)
ROG Strix Scar 18 2023 G834JY-N6005W: Ø52 (44.082-74.8)
NVIDIA GeForce RTX 4090 Laptop GPU
...
max:
» With all tested laptops playable in detail settings ultra.
Additional Benchmarks
Low Preset / Off 1280x720
RT Ultra Preset / On FXAA 1920x1080
0 100 200 300 Tooltip 17X AZF: Ø283 (203.759-357.03)
...
NVIDIA GeForce RTX 4090 Laptop GPU
max:
0 100 200 Tooltip 17X AZF: Ø248 (184.8-298.71)
...
NVIDIA GeForce RTX 4090 Laptop GPU
max:
0 100 200 Tooltip 17X AZF: Ø216 (166.792-272.9)
...
NVIDIA GeForce RTX 4090 Laptop GPU
max:
0 100 200 300 Tooltip ROG Strix Scar 18 2023 G834JY-N6005W: Ø184.5 (134.73-253.3)
17X AZF: Ø193.6 (152.74-353.4)
...
NVIDIA GeForce RTX 4090 Laptop GPU
max:
0 100 Tooltip ROG Strix Scar 18 2023 G834JY-N6005W: Ø125.4 (99.616-140.6)
17X AZF: Ø128.9 (104.138-145.17)
...
NVIDIA GeForce RTX 4090 Laptop GPU
max:
0 100 Tooltip ROG Strix Scar 18 2023 G834JY-N6005W: Ø57.9 (48.02-128)
17X AZF: Ø58.3 (49.1-67.91)
...
NVIDIA GeForce RTX 4090 Laptop GPU
max:
» With all tested laptops playable in detail settings ultra.
Additional Benchmarks
Low Preset 1280x720
254 [X] Aorus 17X AZF Intel Core i9-13900HX 1.6GHz
NVIDIA GeForce RTX 4090 Laptop GPU
min:
35.5 fps, P0.1:
109.7 fps, P1:
163.4 fps, max:
410 fps
...
NVIDIA GeForce RTX 4090 Laptop GPU
max:
...
NVIDIA GeForce RTX 4090 Laptop GPU
max:
...
NVIDIA GeForce RTX 4090 Laptop GPU
...
max:
...
NVIDIA GeForce RTX 4090 Laptop GPU
...
max:
...
NVIDIA GeForce RTX 4090 Laptop GPU
...
max:
...
NVIDIA GeForce RTX 4090 Laptop GPU
...
max:
» With all tested laptops playable in detail settings ultra.
Additional Benchmarks
Low Preset (without FSR Upscaling) 1280x720
Ultra Preset (without FSR Upscaling) + Full Ray-Tracing 1920x1080
0 100 200 Tooltip ROG Strix Scar 18 2023 G834JY-N6005W: Ø135 (102.094-280.2)
...
NVIDIA GeForce RTX 4090 Laptop GPU
max:
0 100 Tooltip ROG Strix Scar 18 2023 G834JY-N6005W: Ø116 (88.42-195.1)
...
NVIDIA GeForce RTX 4090 Laptop GPU
max:
0 100 Tooltip ROG Strix Scar 18 2023 G834JY-N6005W: Ø86.3 (76.612-108.3)
NVIDIA GeForce RTX 4090 Laptop GPU
max:
» With all tested laptops playable in detail settings ultra.
...
NVIDIA GeForce RTX 4090 Laptop GPU
max:
...
NVIDIA GeForce RTX 4090 Laptop GPU
max:
...
NVIDIA GeForce RTX 4090 Laptop GPU
max:
0 100 200 Tooltip ROG Strix Scar 18 2023 G834JY-N6005W: Ø117.3 (104.1-264.7)
...
NVIDIA GeForce RTX 4090 Laptop GPU
max:
0 100 200 300 400 500 600 700 800 900 1000 Tooltip ROG Strix Scar 18 2023 G834JY-N6005W: Ø167.7 (98.53-1100)
...
NVIDIA GeForce RTX 4090 Laptop GPU
...
max:
0 Tooltip ROG Strix Scar 18 2023 G834JY-N6005W: Ø75.5 (71.409-81.86)
...
NVIDIA GeForce RTX 4090 Laptop GPU
...
max:
» With all tested laptops playable in detail settings ultra.
Additional Benchmarks
Very High Preset + Ray-Tracing TAA 1920x0180
...
NVIDIA GeForce RTX 4090 Laptop GPU
max:
...
NVIDIA GeForce RTX 4090 Laptop GPU
...
max:
...
NVIDIA GeForce RTX 4090 Laptop GPU
...
max:
141 148 154 155 [X] Asus ROG Flow Z13 ACRNM Intel Core i9-13900H 1.9GHz
NVIDIA GeForce RTX 4090 Laptop GPU
min:
93 fps
170 170 176 177 [X] Alienware M18 R1 QHD Intel Core i9-13900HX 1.6GHz
NVIDIA GeForce RTX 4090 Laptop GPU
min:
102 fps
177 [X] MSI Raider GE78 HX 13VI Intel Core i9-13980HX 1.6GHz
NVIDIA GeForce RTX 4090 Laptop GPU
min:
102 fps
180 181 182 ~ 168 fps
+ Compare
- Hide Comparison
...
NVIDIA GeForce RTX 4090 Laptop GPU
max:
104 111 119 [X] Asus ROG Flow Z13 ACRNM Intel Core i9-13900H 1.9GHz
NVIDIA GeForce RTX 4090 Laptop GPU
min:
62 fps
122 125 127 132 132 [X] Alienware M18 R1 QHD Intel Core i9-13900HX 1.6GHz
NVIDIA GeForce RTX 4090 Laptop GPU
min:
69 fps
135 135 136 136 [X] MSI Raider GE78 HX 13VI Intel Core i9-13980HX 1.6GHz
NVIDIA GeForce RTX 4090 Laptop GPU
min:
71 fps
137 ~ 127 fps
+ Compare
- Hide Comparison
...
NVIDIA GeForce RTX 4090 Laptop GPU
max:
63 69 75 75 [X] Asus ROG Flow Z13 ACRNM Intel Core i9-13900H 1.9GHz
NVIDIA GeForce RTX 4090 Laptop GPU
min:
34 fps
81 81 [X] Alienware M18 R1 QHD Intel Core i9-13900HX 1.6GHz
NVIDIA GeForce RTX 4090 Laptop GPU
min:
37 fps
82 82 83 83 [X] MSI Raider GE78 HX 13VI Intel Core i9-13980HX 1.6GHz
NVIDIA GeForce RTX 4090 Laptop GPU
min:
39 fps
85 86 ~ 79 fps
+ Compare
- Hide Comparison
...
NVIDIA GeForce RTX 4090 Laptop GPU
max:
» With all tested laptops playable in detail settings ultra.
Additional Benchmarks
Basic Quality Preset T2X SMAA 1280x720
Extreme Quality Preset DLSS Balanced T2X Filmic SMAA 3840x2160
0 100 200 300 400 500 Tooltip ROG Strix Scar 18 2023 G834JY-N6005W: Ø126.3 (92.737-519)
...
NVIDIA GeForce RTX 4090 Laptop GPU
max:
0 100 200 300 Tooltip ROG Strix Scar 18 2023 G834JY-N6005W: Ø117.9 (90.256-350)
...
NVIDIA GeForce RTX 4090 Laptop GPU
max:
0 100 Tooltip ROG Strix Scar 18 2023 G834JY-N6005W: Ø69.1 (61.148-158.4)
NVIDIA GeForce RTX 4090 Laptop GPU
max:
» With all tested laptops playable in detail settings ultra.
...
NVIDIA GeForce RTX 4090 Laptop GPU
max:
NVIDIA RTX 6000 Ada Generation
0 100 Tooltip ROG Strix Scar 18 2023 G834JY-N6005W: Ø100.8 (87.014-191.7)
...
NVIDIA GeForce RTX 4090 Laptop GPU
...
max:
0 100 Tooltip ROG Strix Scar 18 2023 G834JY-N6005W: Ø74.6 (65.137-119.2)
...
NVIDIA GeForce RTX 4090 Laptop GPU
...
max:
0 Tooltip ROG Strix Scar 18 2023 G834JY-N6005W: Ø43.6 (38.014-55.9)
...
NVIDIA GeForce RTX 4090 Laptop GPU
...
max:
» With all tested laptops playable in detail settings ultra.
Additional Benchmarks
Ultra DLSS Quality + Frame Generation 3840x2160
Ultra DLSS Quality 3840x2160
0 100 200 Tooltip ROG Strix Scar 18 2023 G834JY-N6005W: Ø187.2 (145.11-226.1)
...
NVIDIA GeForce RTX 4090 Laptop GPU
max:
0 100 200 Tooltip ROG Strix Scar 18 2023 G834JY-N6005W: Ø186.8 (136.37-248.9)
...
NVIDIA GeForce RTX 4090 Laptop GPU
max:
0 100 200 Tooltip ROG Strix Scar 18 2023 G834JY-N6005W: Ø168.8 (147.4-244)
NVIDIA GeForce RTX 4090 Laptop GPU
max:
» With all tested laptops playable in detail settings ultra.
0 100 200 300 Tooltip Erazer Beast X40: Ø287 (195.97-394.9)
...
NVIDIA GeForce RTX 4090 Laptop GPU
max:
0 100 200 300 400 500 Tooltip Erazer Beast X40: Ø222 (149.77-513)
...
NVIDIA GeForce RTX 4090 Laptop GPU
max:
0 100 200 Tooltip Erazer Beast X40: Ø179.4 (137.438-229.017)
...
NVIDIA GeForce RTX 4090 Laptop GPU
max:
0 100 200 300 Tooltip Erazer Beast X40: Ø155.3 (114.058-337.5)
...
NVIDIA GeForce RTX 4090 Laptop GPU
max:
0 100 200 300 400 500 600 Tooltip Erazer Beast X40: Ø118.1 (83.395-615)
...
NVIDIA GeForce RTX 4090 Laptop GPU
max:
» With all tested laptops playable in detail settings ultra.
Additional Benchmarks
Low Preset 1280x720
317 [X] Medion Erazer Beast X40 Intel Core i9-13900HX 1.6GHz
NVIDIA GeForce RTX 4090 Laptop GPU
min:
21.5 fps, P0.1:
105.5 fps, P1:
204 fps, max:
472 fps
210 [X] Eurocom Raptor X17 959964
Intel Core i9-13900HX 1.6GHz
NVIDIA GeForce RTX 4090 Laptop GPU
min:
176 fps, P1:
97 fps, max:
259 fps
254 266 301 [X] Medion Erazer Beast X40 959964
Intel Core i9-13900HX 1.6GHz
NVIDIA GeForce RTX 4090 Laptop GPU
min:
218 fps, P1:
166 fps, max:
347 fps
301 303 315 [X] Aorus 17X AZF 959964
Intel Core i9-13900HX 1.6GHz
NVIDIA GeForce RTX 4090 Laptop GPU
min:
222 fps, P1:
161 fps, max:
364 fps
316 [X] MSI Titan GT77 HX 13VI 946728
Intel Core i9-13950HX 1.6GHz
NVIDIA GeForce RTX 4090 Laptop GPU
min:
221 fps, P1:
136 fps, max:
372 fps
319 319 [X] MSI Raider GE78 HX 13VI 959964
Intel Core i9-13980HX 1.6GHz
NVIDIA GeForce RTX 4090 Laptop GPU
min:
220 fps, P1:
167 fps, max:
365 fps
336 [X] Alienware m18 R1 959964
Intel Core i9-13980HX 1.6GHz
NVIDIA GeForce RTX 4090 Laptop GPU
min:
254 fps, P1:
185 fps, max:
383 fps
336 [X] Lenovo Legion 9 16IRX8 959964
Intel Core i9-13980HX 1.6GHz
NVIDIA GeForce RTX 4090 Laptop GPU
min:
222 fps, P1:
167 fps, max:
405 fps
375 [X] Eluktronics Mech-17 GP2 959964
Intel Core i9-13900HX 1.6GHz
NVIDIA GeForce RTX 4090 Laptop GPU
min:
257 fps, P1:
207 fps, max:
433 fps
~ 304 fps
+ Compare
- Hide Comparison
...
NVIDIA GeForce RTX 4090 Laptop GPU
...
max:
209 [X] Eurocom Raptor X17 959964
Intel Core i9-13900HX 1.6GHz
NVIDIA GeForce RTX 4090 Laptop GPU
min:
161 fps, P1:
96 fps, max:
247 fps
243 264 286 290 [X] Medion Erazer Beast X40 959964
Intel Core i9-13900HX 1.6GHz
NVIDIA GeForce RTX 4090 Laptop GPU
min:
10 fps, P1:
167 fps, max:
348 fps
294 [X] MSI Titan GT77 HX 13VI 946728
Intel Core i9-13950HX 1.6GHz
NVIDIA GeForce RTX 4090 Laptop GPU
min:
222 fps, P1:
116 fps, max:
374 fps
299 [X] Aorus 17X AZF 959964
Intel Core i9-13900HX 1.6GHz
NVIDIA GeForce RTX 4090 Laptop GPU
min:
227 fps, P1:
158 fps, max:
359 fps
299 [X] MSI Raider GE78 HX 13VI 959964
Intel Core i9-13980HX 1.6GHz
NVIDIA GeForce RTX 4090 Laptop GPU
min:
235 fps, P1:
156 fps, max:
366 fps
303 308 320 [X] Alienware m18 R1 959964
Intel Core i9-13980HX 1.6GHz
NVIDIA GeForce RTX 4090 Laptop GPU
min:
249 fps, P1:
161 fps, max:
376 fps
333 [X] Lenovo Legion 9 16IRX8 959964
Intel Core i9-13980HX 1.6GHz
NVIDIA GeForce RTX 4090 Laptop GPU
min:
258 fps, P1:
175 fps, max:
399 fps
358 [X] Eluktronics Mech-17 GP2 959964
Intel Core i9-13900HX 1.6GHz
NVIDIA GeForce RTX 4090 Laptop GPU
min:
243 fps, P1:
204 fps, max:
420 fps
~ 293 fps
+ Compare
- Hide Comparison
...
NVIDIA GeForce RTX 4090 Laptop GPU
...
max:
199 [X] Eurocom Raptor X17 959964
Intel Core i9-13900HX 1.6GHz
NVIDIA GeForce RTX 4090 Laptop GPU
min:
156 fps, P1:
92 fps, max:
230 fps
220 221 223 264 [X] SCHENKER XMG Neo 16 E23 959964
Intel Core i9-13900HX 1.6GHz
NVIDIA GeForce RTX 4090 Laptop GPU
min:
188 fps, P1:
140 fps, max:
306 fps
265 268 [X] Medion Erazer Beast X40 959964
Intel Core i9-13900HX 1.6GHz
NVIDIA GeForce RTX 4090 Laptop GPU
min:
211 fps, P1:
150 fps, max:
300 fps
273 279 281 283 [X] MSI Titan GT77 HX 13VI 946728
Intel Core i9-13950HX 1.6GHz
NVIDIA GeForce RTX 4090 Laptop GPU
min:
209 fps, P1:
116 fps, max:
345 fps
283 [X] Aorus 17X AZF 959964
Intel Core i9-13900HX 1.6GHz
NVIDIA GeForce RTX 4090 Laptop GPU
min:
208 fps, P1:
143 fps, max:
322 fps
286 [X] Lenovo Legion 9 16IRX8 959964
Intel Core i9-13980HX 1.6GHz
NVIDIA GeForce RTX 4090 Laptop GPU
min:
200 fps, P1:
146 fps, max:
341 fps
294 [X] MSI Raider GE78 HX 13VI 959964
Intel Core i9-13980HX 1.6GHz
NVIDIA GeForce RTX 4090 Laptop GPU
min:
223 fps, P1:
153 fps, max:
344 fps
318 [X] Alienware m18 R1 959964
Intel Core i9-13980HX 1.6GHz
NVIDIA GeForce RTX 4090 Laptop GPU
min:
231 fps, P1:
173 fps, max:
392 fps
322 [X] Eluktronics Mech-17 GP2 959964
Intel Core i9-13900HX 1.6GHz
NVIDIA GeForce RTX 4090 Laptop GPU
min:
217 fps, P1:
181 fps, max:
367 fps
~ 267 fps
+ Compare
- Hide Comparison
...
NVIDIA GeForce RTX 4090 Laptop GPU
...
max:
70.3 [X] Asus ROG Flow Z13 ACRNM 959964
Intel Core i9-13900H 1.9GHz
NVIDIA GeForce RTX 4090 Laptop GPU
min:
54 fps, P1:
36 fps, max:
85 fps
98.4 114.3 114.3 116.3 118.2 [X] Medion Erazer Beast X40 959964
Intel Core i9-13900HX 1.6GHz
NVIDIA GeForce RTX 4090 Laptop GPU
min:
98 fps, P1:
70 fps, max:
139 fps
120 [X] SCHENKER XMG Neo 16 E23 959964
Intel Core i9-13900HX 1.6GHz
NVIDIA GeForce RTX 4090 Laptop GPU
min:
106 fps, P1:
72 fps, max:
143 fps
120.8 [X] Eurocom Raptor X17 959964
Intel Core i9-13900HX 1.6GHz
NVIDIA GeForce RTX 4090 Laptop GPU
min:
103 fps, P1:
70 fps, max:
135 fps
124.5 128.9 [X] Aorus 17X AZF 959964
Intel Core i9-13900HX 1.6GHz
NVIDIA GeForce RTX 4090 Laptop GPU
min:
108 fps, P1:
78 fps, max:
152 fps
129.2 130.8 [X] Lenovo Legion 9 16IRX8 959964
Intel Core i9-13980HX 1.6GHz
NVIDIA GeForce RTX 4090 Laptop GPU
min:
95 fps, P1:
78 fps, max:
149 fps
132.1 [X] Medion Erazer Beast X40 959964, dGPU, Cooling
Intel Core i9-13900HX 1.6GHz
NVIDIA GeForce RTX 4090 Laptop GPU
min:
109 fps, P1:
87 fps, max:
156 fps
134.4 [X] Alienware M18 R1 QHD 959964
Intel Core i9-13900HX 1.6GHz
NVIDIA GeForce RTX 4090 Laptop GPU
min:
79 fps, P1:
75 fps, max:
155 fps
134.8 [X] Medion Erazer Beast X40 959964, dGPU
Intel Core i9-13900HX 1.6GHz
NVIDIA GeForce RTX 4090 Laptop GPU
min:
113 fps, P1:
87 fps, max:
156 fps
135.9 137.1 [X] MSI Raider GE78 HX 13VI 959964
Intel Core i9-13980HX 1.6GHz
NVIDIA GeForce RTX 4090 Laptop GPU
min:
115 fps, P1:
79 fps, max:
161 fps
137.4 138.2 [X] MSI Titan GT77 HX 13VI 946728
Intel Core i9-13950HX 1.6GHz
NVIDIA GeForce RTX 4090 Laptop GPU
min:
118 fps, P1:
84 fps, max:
161 fps
140.6 [X] Eluktronics Mech-17 GP2 959964
Intel Core i9-13900HX 1.6GHz
NVIDIA GeForce RTX 4090 Laptop GPU
min:
123 fps, P1:
97 fps, max:
160 fps
144.7 [X] Alienware m18 R1 959964
Intel Core i9-13980HX 1.6GHz
NVIDIA GeForce RTX 4090 Laptop GPU
min:
124 fps, P1:
94 fps, max:
166 fps
~ 125 fps
+ Compare
- Hide Comparison
...
NVIDIA GeForce RTX 4090 Laptop GPU
...
max:
65.9 75 78.7 [X] Asus ROG Flow Z13 ACRNM 959964
Intel Core i9-13900H 1.9GHz
NVIDIA GeForce RTX 4090 Laptop GPU
min:
70 fps, P1:
55 fps, max:
87 fps
79.7 79.9 [X] Medion Erazer Beast X40 959964
Intel Core i9-13900HX 1.6GHz
NVIDIA GeForce RTX 4090 Laptop GPU
min:
70 fps, P1:
53 fps, max:
87 fps
80.3 82.8 [X] SCHENKER XMG Neo 16 E23 959964
Intel Core i9-13900HX 1.6GHz
NVIDIA GeForce RTX 4090 Laptop GPU
min:
69 fps, P1:
55 fps, max:
92 fps
83.5 [X] Aorus 17X AZF 959964
Intel Core i9-13900HX 1.6GHz
NVIDIA GeForce RTX 4090 Laptop GPU
min:
71 fps, P1:
43 fps, max:
96 fps
85.2 86.2 [X] Medion Erazer Beast X40 959964, dGPU
Intel Core i9-13900HX 1.6GHz
NVIDIA GeForce RTX 4090 Laptop GPU
min:
76 fps, P1:
69 fps, max:
101 fps
87.4 [X] Medion Erazer Beast X40 959964, dGPU, Cooling
Intel Core i9-13900HX 1.6GHz
NVIDIA GeForce RTX 4090 Laptop GPU
min:
77 fps, P1:
67 fps, max:
99 fps
89.3 [X] MSI Raider GE78 HX 13VI 959964
Intel Core i9-13980HX 1.6GHz
NVIDIA GeForce RTX 4090 Laptop GPU
min:
76 fps, P1:
70 fps, max:
103 fps
90.1 [X] MSI Titan GT77 HX 13VI 946728
Intel Core i9-13950HX 1.6GHz
NVIDIA GeForce RTX 4090 Laptop GPU
min:
78 fps, P1:
71 fps, max:
104 fps
90.2 [X] Eurocom Raptor X17 959964
Intel Core i9-13900HX 1.6GHz
NVIDIA GeForce RTX 4090 Laptop GPU
min:
76 fps, P1:
65 fps, max:
103 fps
90.5 90.6 [X] Alienware M18 R1 QHD 959964
Intel Core i9-13900HX 1.6GHz
NVIDIA GeForce RTX 4090 Laptop GPU
min:
77 fps, P1:
72 fps, max:
106 fps
90.9 [X] Lenovo Legion 9 16IRX8 959964
Intel Core i9-13980HX 1.6GHz
NVIDIA GeForce RTX 4090 Laptop GPU
min:
76 fps, P1:
56 fps, max:
105 fps
91.8 [X] Eluktronics Mech-17 GP2 959964
Intel Core i9-13900HX 1.6GHz
NVIDIA GeForce RTX 4090 Laptop GPU
min:
78 fps, P1:
74 fps, max:
108 fps
91.8 92.1 92.2 [X] Alienware m18 R1 959964
Intel Core i9-13980HX 1.6GHz
NVIDIA GeForce RTX 4090 Laptop GPU
min:
79 fps, P1:
74 fps, max:
106 fps
~ 85 fps
+ Compare
- Hide Comparison
...
NVIDIA GeForce RTX 4090 Laptop GPU
max:
36.8 40.6 [X] Asus ROG Flow Z13 ACRNM 959964
Intel Core i9-13900H 1.9GHz
NVIDIA GeForce RTX 4090 Laptop GPU
min:
35 fps, P1:
32 fps, max:
47 fps
42.4 43 [X] Aorus 17X AZF 959964
Intel Core i9-13900HX 1.6GHz
NVIDIA GeForce RTX 4090 Laptop GPU
min:
37 fps, P1:
34 fps, max:
49 fps
43.9 [X] MSI Raider GE78 HX 13VI 959964
Intel Core i9-13980HX 1.6GHz
NVIDIA GeForce RTX 4090 Laptop GPU
min:
37 fps, P1:
34 fps, max:
50 fps
44 44.3 [X] Eurocom Raptor X17 959964
Intel Core i9-13900HX 1.6GHz
NVIDIA GeForce RTX 4090 Laptop GPU
min:
38 fps, P1:
37 fps, max:
51 fps
44.9 [X] MSI Titan GT77 HX 13VI 946728
Intel Core i9-13950HX 1.6GHz
NVIDIA GeForce RTX 4090 Laptop GPU
min:
38 fps, P1:
37 fps, max:
52 fps
45 45.3 45.3 [X] Eluktronics Mech-17 GP2 959964
Intel Core i9-13900HX 1.6GHz
NVIDIA GeForce RTX 4090 Laptop GPU
min:
39 fps, P1:
37 fps, max:
52 fps
45.5 [X] Alienware m18 R1 959964
Intel Core i9-13980HX 1.6GHz
NVIDIA GeForce RTX 4090 Laptop GPU
min:
38 fps, P1:
37 fps, max:
52 fps
45.8 45.9 46.1 [X] Alienware M18 R1 QHD 959964
Intel Core i9-13900HX 1.6GHz
NVIDIA GeForce RTX 4090 Laptop GPU
min:
39 fps, P1:
37 fps, max:
53 fps
~ 44 fps
+ Compare
- Hide Comparison
...
NVIDIA GeForce RTX 4090 Laptop GPU
max:
» With all tested laptops playable in detail settings ultra.
Additional Benchmarks
Ultra Low Preset 16xAF TAA 1280x720
373 [X] Aorus 17X AZF Intel Core i9-13900HX 1.6GHz
NVIDIA GeForce RTX 4090 Laptop GPU
min:
272 fps, P1:
225 fps, max:
401 fps
420 [X] Alienware m18 R1 959964
Intel Core i9-13980HX 1.6GHz
NVIDIA GeForce RTX 4090 Laptop GPU
min:
312 fps, P1:
259 fps, max:
468 fps
267 [X] Eurocom Raptor X17 Intel Core i9-13900HX 1.6GHz
NVIDIA GeForce RTX 4090 Laptop GPU
min:
206 fps, P1:
113 fps, max:
311 fps
397 [X] MSI Raider GE78 HX 13VI Intel Core i9-13980HX 1.6GHz
NVIDIA GeForce RTX 4090 Laptop GPU
min:
289 fps, P1:
254 fps, max:
431 fps
0 100 200 300 400 Tooltip ROG Strix Scar 18 2023 G834JY-N6005W: Ø290 (205.376-424.35)
...
NVIDIA GeForce RTX 4090 Laptop GPU
max:
0 100 200 300 Tooltip ROG Strix Scar 18 2023 G834JY-N6005W: Ø244 (213.94-316.4)
...
NVIDIA GeForce RTX 4090 Laptop GPU
max:
0 100 Tooltip ROG Strix Scar 18 2023 G834JY-N6005W: Ø140.6 (124.09-169.53)
...
NVIDIA GeForce RTX 4090 Laptop GPU
max:
» With all tested laptops playable in detail settings ultra.
...
NVIDIA GeForce RTX 4090 Laptop GPU
max:
...
NVIDIA GeForce RTX 4090 Laptop GPU
max:
...
NVIDIA GeForce RTX 4090 Laptop GPU
max:
...
NVIDIA GeForce RTX 4090 Laptop GPU
max:
...
NVIDIA GeForce RTX 4090 Laptop GPU
max:
...
NVIDIA GeForce RTX 4090 Laptop GPU
max:
» With all tested laptops playable in detail settings ultra.
Additional Benchmarks
Highest Settings + Maximum Ray Tracing 1920x1080
...
NVIDIA GeForce RTX 4090 Laptop GPU
max:
...
NVIDIA GeForce RTX 4090 Laptop GPU
max:
...
NVIDIA GeForce RTX 4090 Laptop GPU
...
max:
...
NVIDIA GeForce RTX 4090 Laptop GPU
max:
...
NVIDIA GeForce RTX 4090 Laptop GPU
max:
...
NVIDIA GeForce RTX 4090 Laptop GPU
max:
» With all tested laptops playable in detail settings ultra.
Additional Benchmarks
Lowest Preset (DX12) 1280x720
...
NVIDIA GeForce RTX 4090 Laptop GPU
max:
AMD Radeon RX 7800 XT
...
NVIDIA GeForce RTX 4090 Laptop GPU
...
max:
...
NVIDIA GeForce RTX 4090 Laptop GPU
...
max:
91 [X] Eurocom Raptor X17 Intel Core i9-13900HX 1.6GHz
NVIDIA GeForce RTX 4090 Laptop GPU
min:
22 fps, max:
156.1 fps
96.6 103 [X] Asus ROG Ally Z1 Extreme AMD Ryzen Z1 Extreme 3.3GHz
NVIDIA GeForce RTX 4090 Laptop GPU
104.5 105.4 119.7 121.6 [X] Asus ROG Flow Z13 ACRNM Intel Core i9-13900H 1.9GHz
NVIDIA GeForce RTX 4090 Laptop GPU
min:
34.72 fps, max:
154.63 fps
122.8 127.9 [X] Alienware m18 R1 Intel Core i9-13980HX 1.6GHz
NVIDIA GeForce RTX 4090 Laptop GPU
min:
32.4 fps, max:
213.2 fps
127.9 [X] Alienware M18 R1 QHD Intel Core i9-13900HX 1.6GHz
NVIDIA GeForce RTX 4090 Laptop GPU
min:
59.99 fps, max:
180.1 fps
130.6 131.4 133.8 135 135.1 [X] MSI Raider GE78 HX 13VI Intel Core i9-13980HX 1.6GHz
NVIDIA GeForce RTX 4090 Laptop GPU
min:
44.88 fps, max:
182.01 fps
143.4 [X] SCHENKER XMG Neo 16 E23 1.61
Intel Core i9-13900HX 1.6GHz
NVIDIA GeForce RTX 4090 Laptop GPU
min:
82.1 fps, max:
187.3 fps
157 159.7 ~ 125 fps
+ Compare
- Hide Comparison
...
NVIDIA GeForce RTX 4090 Laptop GPU
...
max:
75.7 78 86 86.7 87.3 [X] Eurocom Raptor X17 Intel Core i9-13900HX 1.6GHz
NVIDIA GeForce RTX 4090 Laptop GPU
min:
21.3 fps, max:
156 fps
89 [X] Asus ROG Ally Z1 Extreme AMD Ryzen Z1 Extreme 3.3GHz
NVIDIA GeForce RTX 4090 Laptop GPU
91.1 [X] Asus ROG Flow Z13 ACRNM Intel Core i9-13900H 1.9GHz
NVIDIA GeForce RTX 4090 Laptop GPU
min:
27.82 fps, max:
141.41 fps
94.3 94.5 98 98.8 100.9 101.3 102.2 [X] Alienware m18 R1 Intel Core i9-13980HX 1.6GHz
NVIDIA GeForce RTX 4090 Laptop GPU
min:
48.9 fps, max:
193.9 fps
102.2 [X] Alienware M18 R1 QHD Intel Core i9-13900HX 1.6GHz
NVIDIA GeForce RTX 4090 Laptop GPU
min:
41.4 fps, max:
165.62 fps
104.2 [X] MSI Raider GE78 HX 13VI Intel Core i9-13980HX 1.6GHz
NVIDIA GeForce RTX 4090 Laptop GPU
min:
25.19 fps, max:
148.98 fps
104.3 112.1 [X] SCHENKER XMG Neo 16 E23 1.61
Intel Core i9-13900HX 1.6GHz
NVIDIA GeForce RTX 4090 Laptop GPU
min:
25.5 fps, max:
162 fps
116 ~ 96 fps
+ Compare
- Hide Comparison
...
NVIDIA GeForce RTX 4090 Laptop GPU
max:
38.8 41.9 45 [X] Asus ROG Ally Z1 Extreme AMD Ryzen Z1 Extreme 3.3GHz
NVIDIA GeForce RTX 4090 Laptop GPU
45.4 45.9 [X] Asus ROG Flow Z13 ACRNM Intel Core i9-13900H 1.9GHz
NVIDIA GeForce RTX 4090 Laptop GPU
min:
34.34 fps, max:
66.42 fps
47.3 [X] Eurocom Raptor X17 Intel Core i9-13900HX 1.6GHz
NVIDIA GeForce RTX 4090 Laptop GPU
min:
19.1 fps, max:
125.5 fps
47.8 48.6 49.2 49.9 [X] MSI Raider GE78 HX 13VI Intel Core i9-13980HX 1.6GHz
NVIDIA GeForce RTX 4090 Laptop GPU
min:
39.55 fps, max:
66.62 fps
50 [X] Alienware m18 R1 Intel Core i9-13980HX 1.6GHz
NVIDIA GeForce RTX 4090 Laptop GPU
min:
36.8 fps, max:
91.2 fps
50 [X] Alienware M18 R1 QHD Intel Core i9-13900HX 1.6GHz
NVIDIA GeForce RTX 4090 Laptop GPU
min:
37.75 fps, max:
79.2 fps
50.1 51 56 ~ 48 fps
+ Compare
- Hide Comparison
...
NVIDIA GeForce RTX 4090 Laptop GPU
max:
» With all tested laptops playable in detail settings ultra.
Additional Benchmarks
Low Preset 1280x720
Ray Tracing Ultra Preset (DLSS off) 1920x1080
68.5 [X] Asus ROG Flow Z13 ACRNM Intel Core i9-13900H 1.9GHz
NVIDIA GeForce RTX 4090 Laptop GPU
min:
26.09 fps, max:
96.42 fps
Ray Tracing Ultra Preset (DLSS off) 3840x2160
20.6 [X] Asus ROG Flow Z13 ACRNM Intel Core i9-13900H 1.9GHz
NVIDIA GeForce RTX 4090 Laptop GPU
min:
15.5 fps, max:
28.41 fps
0 100 Tooltip Erazer Beast X40: Ø120.2 (117.128-129.7)
...
NVIDIA GeForce RTX 4090 Laptop GPU
0 100 Tooltip Erazer Beast X40: Ø121.9 (116.057-199.4)
...
NVIDIA GeForce RTX 4090 Laptop GPU
...
0 100 Tooltip Erazer Beast X40: Ø120.9 (115.013-161.9)
...
NVIDIA GeForce RTX 4090 Laptop GPU
0 100 Tooltip Erazer Beast X40: Ø119 (114.269-128.5)
...
NVIDIA GeForce RTX 4090 Laptop GPU
0 100 200 Tooltip Erazer Beast X40: Ø126.3 (115.01-272.2)
...
NVIDIA GeForce RTX 4090 Laptop GPU
» With all tested laptops playable in detail settings ultra.
Additional Benchmarks
Low / Off 1280x720
117.8 [X] Medion Erazer Beast X40 Intel Core i9-13900HX 1.6GHz
NVIDIA GeForce RTX 4090 Laptop GPU
min:
44.9 fps, P0.1:
87.8 fps, P1:
97.8 fps, max:
184.3 fps
...
NVIDIA GeForce RTX 4090 Laptop GPU
...
max:
...
NVIDIA GeForce RTX 4090 Laptop GPU
...
max:
...
NVIDIA GeForce RTX 4090 Laptop GPU
...
max:
...
NVIDIA GeForce RTX 4090 Laptop GPU
...
max:
...
NVIDIA GeForce RTX 4090 Laptop GPU
max:
...
NVIDIA GeForce RTX 4090 Laptop GPU
max:
» With all tested laptops playable in detail settings ultra.
Additional Benchmarks
Low Preset 1280x720
229 [X] Aorus 17X AZF Intel Core i9-13900HX 1.6GHz
NVIDIA GeForce RTX 4090 Laptop GPU
min:
61.6 fps, max:
358 fps
...
NVIDIA GeForce RTX 4090 Laptop GPU
max:
...
NVIDIA GeForce RTX 4090 Laptop GPU
...
max:
...
NVIDIA GeForce RTX 4090 Laptop GPU
...
max:
...
NVIDIA GeForce RTX 4090 Laptop GPU
...
max:
...
NVIDIA GeForce RTX 4090 Laptop GPU
max:
0 100 Tooltip ROG Strix Scar 18 2023 G834JY-N6005W: Ø73.5 (59.013-167.3)
...
NVIDIA GeForce RTX 4090 Laptop GPU
max:
» With all tested laptops playable in detail settings ultra.
...
NVIDIA GeForce RTX 4090 Laptop GPU
max:
...
NVIDIA GeForce RTX 4090 Laptop GPU
max:
...
NVIDIA GeForce RTX 4090 Laptop GPU
max:
...
NVIDIA GeForce RTX 4090 Laptop GPU
max:
...
NVIDIA GeForce RTX 4090 Laptop GPU
max:
» With all tested laptops playable in detail settings high.
Additional Benchmarks
High Quality Raytracing 1920x1080
...
NVIDIA GeForce RTX 4090 Laptop GPU
max:
...
NVIDIA GeForce RTX 4090 Laptop GPU
max:
...
NVIDIA GeForce RTX 4090 Laptop GPU
max:
...
NVIDIA GeForce RTX 4090 Laptop GPU
max:
...
NVIDIA GeForce RTX 4090 Laptop GPU
max:
...
NVIDIA GeForce RTX 4090 Laptop GPU
max:
» With all tested laptops playable in detail settings ultra.
0 100 200 Tooltip 17X AZF: Ø179 (157.983-209.22)
...
NVIDIA GeForce RTX 4090 Laptop GPU
max:
0 100 200 Tooltip 17X AZF: Ø179.2 (118.297-213.17)
...
NVIDIA GeForce RTX 4090 Laptop GPU
max:
0 100 200 Tooltip 17X AZF: Ø172.2 (150.27-233.4)
...
NVIDIA GeForce RTX 4090 Laptop GPU
max:
0 100 Tooltip 17X AZF: Ø127.9 (111.412-146.9)
...
NVIDIA GeForce RTX 4090 Laptop GPU
max:
0 100 200 300 Tooltip 17X AZF: Ø115.9 (93.712-378)
...
NVIDIA GeForce RTX 4090 Laptop GPU
max:
0 100 Tooltip 17X AZF: Ø77.9 (67.043-110.7)
...
NVIDIA GeForce RTX 4090 Laptop GPU
max:
» With all tested laptops playable in detail settings ultra.
Additional Benchmarks
Low Preset 1280x720
179.9 [X] Aorus 17X AZF Intel Core i9-13900HX 1.6GHz
NVIDIA GeForce RTX 4090 Laptop GPU
min:
32.3 fps, P0.1:
71.7 fps, P1:
125.1 fps, max:
424 fps
0 100 200 300 400 500 600 700 800 900 1000 1100 1200 1300 1400 1500 1600 1700 1800 1900 2000 2100 2200 2300 2400 Tooltip ROG Strix Scar 18 2023 G834JY-N6005W: Ø290 (105.742-2429)
...
NVIDIA GeForce RTX 4090 Laptop GPU
0 100 Tooltip ROG Strix Scar 18 2023 G834JY-N6005W: Ø87.2 (53.72-134.3)
...
NVIDIA GeForce RTX 4090 Laptop GPU
0 Tooltip ROG Strix Scar 18 2023 G834JY-N6005W: Ø60.1 (43.33-81.3)
NVIDIA GeForce RTX 4090 Laptop GPU
» With all tested laptops playable in detail settings ultra.
0 100 200 Tooltip ROG Strix Scar 18 2023 G834JY-N6005W: Ø176.2 (143.787-217.8)
...
NVIDIA GeForce RTX 4090 Laptop GPU
0 100 200 Tooltip ROG Strix Scar 18 2023 G834JY-N6005W: Ø142.4 (88.857-217.6)
NVIDIA GeForce RTX 4090 Laptop GPU
0 Tooltip ROG Strix Scar 18 2023 G834JY-N6005W: Ø86.8 (70.122-97.21)
NVIDIA GeForce RTX 4090 Laptop GPU
» With all tested laptops playable in detail settings ultra.
...
NVIDIA GeForce RTX 4090 Laptop GPU
max:
...
NVIDIA GeForce RTX 4090 Laptop GPU
max:
...
NVIDIA GeForce RTX 4090 Laptop GPU
max:
...
NVIDIA GeForce RTX 4090 Laptop GPU
max:
...
NVIDIA GeForce RTX 4090 Laptop GPU
max:
...
NVIDIA GeForce RTX 4090 Laptop GPU
max:
» With all tested laptops playable in detail settings ultra.
...
NVIDIA GeForce RTX 4090 Laptop GPU
max:
...
NVIDIA GeForce RTX 4090 Laptop GPU
max:
...
NVIDIA GeForce RTX 4090 Laptop GPU
max:
...
NVIDIA GeForce RTX 4090 Laptop GPU
max:
...
NVIDIA GeForce RTX 4090 Laptop GPU
max:
» With all tested laptops playable in detail settings ultra.
Additional Benchmarks
Low Preset 1920x1080
...
NVIDIA GeForce RTX 4090 Laptop GPU
max:
...
NVIDIA GeForce RTX 4090 Laptop GPU
max:
...
NVIDIA GeForce RTX 4090 Laptop GPU
max:
...
NVIDIA GeForce RTX 4090 Laptop GPU
max:
...
NVIDIA GeForce RTX 4090 Laptop GPU
max:
» With all tested laptops playable in detail settings ultra.
Additional Benchmarks
Low Preset 1920x1080
Ultra Preset + Ultra Ray-Tracing 1920x1080
0 100 200 300 400 500 Tooltip Erazer Beast X40: Ø403 (305.073-507.68)
...
NVIDIA GeForce RTX 4090 Laptop GPU
0 100 200 300 400 500 600 Tooltip Erazer Beast X40: Ø321 (225.32-615)
...
NVIDIA GeForce RTX 4090 Laptop GPU
0 100 200 300 400 Tooltip Erazer Beast X40: Ø311 (216.16-461.825)
...
NVIDIA GeForce RTX 4090 Laptop GPU
0 100 200 300 400 Tooltip Erazer Beast X40: Ø330 (247.011-458.66)
...
NVIDIA GeForce RTX 4090 Laptop GPU
» With all tested laptops playable in detail settings ultra.
Additional Benchmarks
Low Preset (DX12) 1920x1080
378 [X] Medion Erazer Beast X40 Intel Core i9-13900HX 1.6GHz
NVIDIA GeForce RTX 4090 Laptop GPU
min:
56.2 fps, P0.1:
168.4 fps, P1:
249 fps, max:
630 fps
0 100 200 Tooltip 17X AZF: Ø175.7 (145-252)
...
NVIDIA GeForce RTX 4090 Laptop GPU
max:
AMD Radeon RX 7600
0 100 200 Tooltip 17X AZF: Ø154.3 (127-202)
...
NVIDIA GeForce RTX 4090 Laptop GPU
max:
0 100 Tooltip 17X AZF: Ø136.3 (107-198)
...
NVIDIA GeForce RTX 4090 Laptop GPU
...
max:
...
NVIDIA GeForce RTX 4090 Laptop GPU
max:
...
NVIDIA GeForce RTX 4090 Laptop GPU
...
max:
64 71 [X] Asus ROG Ally Z1 Extreme AMD Ryzen Z1 Extreme 3.3GHz
NVIDIA GeForce RTX 4090 Laptop GPU
73 73.1 [X] Aorus 17X AZF Intel Core i9-13900HX 1.6GHz
NVIDIA GeForce RTX 4090 Laptop GPU
min:
58 fps, max:
79 fps
78 [X] Asus ROG Flow Z13 ACRNM Intel Core i9-13900H 1.9GHz
NVIDIA GeForce RTX 4090 Laptop GPU
min:
64 fps, max:
86 fps
82 88 89 89 [X] Alienware M18 R1 QHD Intel Core i9-13900HX 1.6GHz
NVIDIA GeForce RTX 4090 Laptop GPU
min:
79 fps, max:
96 fps
92 ~ 80 fps
+ Compare
- Hide Comparison
+ 📈 Graph
- 📈 Hide Graph
...
NVIDIA GeForce RTX 4090 Laptop GPU
max:
» With all tested laptops playable in detail settings ultra.
Additional Benchmarks
Low Graphics Quality 1920x1080
170.8 [X] Aorus 17X AZF Intel Core i9-13900HX 1.6GHz
NVIDIA GeForce RTX 4090 Laptop GPU
min:
142 fps, max:
234 fps
Ultra Graphics Quality + HD Textures + DXR TAA 1920x1080
84 [X] Asus ROG Flow Z13 ACRNM Intel Core i9-13900H 1.9GHz
NVIDIA GeForce RTX 4090 Laptop GPU
min:
74 fps, max:
117 fps
...
NVIDIA GeForce RTX 4090 Laptop GPU
max:
...
NVIDIA GeForce RTX 4090 Laptop GPU
max:
...
NVIDIA GeForce RTX 4090 Laptop GPU
...
max:
...
NVIDIA GeForce RTX 4090 Laptop GPU
max:
...
NVIDIA GeForce RTX 4090 Laptop GPU
max:
...
NVIDIA GeForce RTX 4090 Laptop GPU
max:
» With all tested laptops playable in detail settings ultra.
0 100 200 Tooltip Erazer Beast X40: Ø180.2 (160.424-213.78)
...
NVIDIA GeForce RTX 4090 Laptop GPU
0 100 Tooltip Erazer Beast X40: Ø167.7 (120.575-194.18)
...
NVIDIA GeForce RTX 4090 Laptop GPU
0 100 200 Tooltip Erazer Beast X40: Ø170.1 (145.046-230.2)
...
NVIDIA GeForce RTX 4090 Laptop GPU
0 100 200 Tooltip Erazer Beast X40: Ø156.6 (129.377-247.4)
...
NVIDIA GeForce RTX 4090 Laptop GPU
0 100 200 Tooltip Erazer Beast X40: Ø147.4 (126.594-223.1)
...
NVIDIA GeForce RTX 4090 Laptop GPU
» With all tested laptops playable in detail settings ultra.
...
NVIDIA GeForce RTX 4090 Laptop GPU
max:
126 129 137 [X] Asus ROG Flow Z13 ACRNM Intel Core i9-13900H 1.9GHz
NVIDIA GeForce RTX 4090 Laptop GPU
min:
57 fps, max:
187 fps
161 161 162 [X] Alienware M18 R1 QHD Intel Core i9-13900HX 1.6GHz
NVIDIA GeForce RTX 4090 Laptop GPU
min:
53 fps, max:
237 fps
169 178 ~ 153 fps
+ Compare
- Hide Comparison
...
NVIDIA GeForce RTX 4090 Laptop GPU
max:
102 111 121 [X] Asus ROG Flow Z13 ACRNM Intel Core i9-13900H 1.9GHz
NVIDIA GeForce RTX 4090 Laptop GPU
min:
54 fps, max:
174 fps
126 130 132 [X] Alienware M18 R1 QHD Intel Core i9-13900HX 1.6GHz
NVIDIA GeForce RTX 4090 Laptop GPU
min:
37 fps, max:
202 fps
135 138 ~ 124 fps
+ Compare
- Hide Comparison
...
NVIDIA GeForce RTX 4090 Laptop GPU
max:
61 69 77 [X] Asus ROG Flow Z13 ACRNM Intel Core i9-13900H 1.9GHz
NVIDIA GeForce RTX 4090 Laptop GPU
min:
44 fps, max:
144 fps
78 79 [X] Alienware M18 R1 QHD Intel Core i9-13900HX 1.6GHz
NVIDIA GeForce RTX 4090 Laptop GPU
min:
25 fps, max:
154 fps
79 80 ~ 75 fps
+ Compare
- Hide Comparison
...
NVIDIA GeForce RTX 4090 Laptop GPU
max:
» With all tested laptops playable in detail settings ultra.
...
NVIDIA GeForce RTX 4090 Laptop GPU
max:
...
NVIDIA GeForce RTX 4090 Laptop GPU
max:
...
NVIDIA GeForce RTX 4090 Laptop GPU
max:
...
NVIDIA GeForce RTX 4090 Laptop GPU
...
max:
...
NVIDIA GeForce RTX 4090 Laptop GPU
...
max:
...
NVIDIA GeForce RTX 4090 Laptop GPU
max:
» With all tested laptops playable in detail settings ultra.
Additional Benchmarks
Ultra Preset + Ultra Ray Tracing (DX12) 1920x1080
...
NVIDIA GeForce RTX 4090 Laptop GPU
max:
...
NVIDIA GeForce RTX 4090 Laptop GPU
max:
...
NVIDIA GeForce RTX 4090 Laptop GPU
max:
...
NVIDIA GeForce RTX 4090 Laptop GPU
max:
...
NVIDIA GeForce RTX 4090 Laptop GPU
max:
» With all tested laptops playable in detail settings high.
0 100 Tooltip ROG Strix Scar 18 2023 G834JY-N6005W: Ø77.9 (26.284-157.3)
...
NVIDIA GeForce RTX 4090 Laptop GPU
0 100 200 300 400 500 600 700 Tooltip ROG Strix Scar 18 2023 G834JY-N6005W: Ø90.6 (20.1-726)
...
NVIDIA GeForce RTX 4090 Laptop GPU
0 Tooltip ROG Strix Scar 18 2023 G834JY-N6005W: Ø53.4 (28.45-90)
...
NVIDIA GeForce RTX 4090 Laptop GPU
» With all tested laptops playable in detail settings ultra.
Additional Benchmarks
Ultra 16xAF DLSS QualityAA 3840x2160
Ultra 16xAF DLSS + Frame GenerationAA 3840x2160
...
NVIDIA GeForce RTX 4090 Laptop GPU
max:
...
NVIDIA GeForce RTX 4090 Laptop GPU
max:
...
NVIDIA GeForce RTX 4090 Laptop GPU
max:
...
NVIDIA GeForce RTX 4090 Laptop GPU
max:
...
NVIDIA GeForce RTX 4090 Laptop GPU
max:
...
NVIDIA GeForce RTX 4090 Laptop GPU
max:
» With all tested laptops playable in detail settings ultra.
Additional Benchmarks
Ultimate Quality DLSS Quality 3840x2160
Ultimate Quality FidelityFX Quality 3840x2160
0 100 200 Tooltip Erazer Beast X40: Ø185.4 (163.16-282.7)
...
NVIDIA GeForce RTX 4090 Laptop GPU
max:
0 100 200 300 400 500 600 700 800 900 1000 1100 1200 Tooltip Erazer Beast X40: Ø208 (153.517-1213)
...
NVIDIA GeForce RTX 4090 Laptop GPU
max:
0 100 200 300 Tooltip Erazer Beast X40: Ø180.9 (150.621-359)
...
NVIDIA GeForce RTX 4090 Laptop GPU
max:
0 100 200 300 400 Tooltip Erazer Beast X40: Ø174.3 (145.116-454)
...
NVIDIA GeForce RTX 4090 Laptop GPU
max:
0 100 200 Tooltip Erazer Beast X40: Ø169.2 (141.14-264.2)
...
NVIDIA GeForce RTX 4090 Laptop GPU
max:
» With all tested laptops playable in detail settings ultra.
...
NVIDIA GeForce RTX 4090 Laptop GPU
max:
...
NVIDIA GeForce RTX 4090 Laptop GPU
max:
...
NVIDIA GeForce RTX 4090 Laptop GPU
max:
...
NVIDIA GeForce RTX 4090 Laptop GPU
max:
...
NVIDIA GeForce RTX 4090 Laptop GPU
max:
...
NVIDIA GeForce RTX 4090 Laptop GPU
max:
» With all tested laptops playable in detail settings ultra.
0 100 200 300 Tooltip Erazer Beast X40: Ø369 (345.002-395.08)
...
NVIDIA GeForce RTX 4090 Laptop GPU
0 100 200 300 400 Tooltip Erazer Beast X40: Ø294 (244.211-468)
...
NVIDIA GeForce RTX 4090 Laptop GPU
0 100 200 300 Tooltip Erazer Beast X40: Ø266 (233.072-321.96)
...
NVIDIA GeForce RTX 4090 Laptop GPU
0 100 200 300 Tooltip Erazer Beast X40: Ø174.2 (154.36-301.5)
...
NVIDIA GeForce RTX 4090 Laptop GPU
max:
» With all tested laptops playable in detail settings high.
...
NVIDIA GeForce RTX 4090 Laptop GPU
...
max:
AMD Radeon RX 7600
...
NVIDIA GeForce RTX 4090 Laptop GPU
...
max:
...
NVIDIA GeForce RTX 4090 Laptop GPU
max:
...
NVIDIA GeForce RTX 4090 Laptop GPU
max:
...
NVIDIA GeForce RTX 4090 Laptop GPU
max:
...
NVIDIA GeForce RTX 4090 Laptop GPU
max:
» With all tested laptops playable in detail settings ultra.
Additional Benchmarks
Very Low Overall Quality (DX11) 1920x1080
...
NVIDIA GeForce RTX 4090 Laptop GPU
...
max:
...
NVIDIA GeForce RTX 4090 Laptop GPU
max:
0 100 200 300 400 500 600 700 800 900 1000 1100 Tooltip ROG Strix Scar 18 2023 G834JY-N6005W: Ø222 (164.795-1109)
...
NVIDIA GeForce RTX 4090 Laptop GPU
max:
0 100 200 300 Tooltip ROG Strix Scar 18 2023 G834JY-N6005W: Ø136.4 (111.812-313.3)
...
NVIDIA GeForce RTX 4090 Laptop GPU
max:
...
NVIDIA GeForce RTX 4090 Laptop GPU
max:
» With all tested laptops playable in detail settings high.
Additional Benchmarks
High Quality Preset & High Ray Tracing Preset (DX12) 1920x1080
High Quality Preset & High Ray Tracing Preset (DX12) 3840x2160
High Quality, High Ray Tracing, DLSS 3840x2160
...
NVIDIA GeForce RTX 4090 Laptop GPU
max:
0 100 200 Tooltip 17X AZF: Ø148.2 (117-218)
...
NVIDIA GeForce RTX 4090 Laptop GPU
max:
0 100 200 Tooltip 17X AZF: Ø144.6 (106-210)
...
NVIDIA GeForce RTX 4090 Laptop GPU
max:
...
NVIDIA GeForce RTX 4090 Laptop GPU
max:
...
NVIDIA GeForce RTX 4090 Laptop GPU
max:
...
NVIDIA GeForce RTX 4090 Laptop GPU
max:
» With all tested laptops playable in detail settings ultra.
...
NVIDIA GeForce RTX 4090 Laptop GPU
max:
...
NVIDIA GeForce RTX 4090 Laptop GPU
...
max:
...
NVIDIA GeForce RTX 4090 Laptop GPU
...
max:
...
NVIDIA GeForce RTX 4090 Laptop GPU
...
max:
...
NVIDIA GeForce RTX 4090 Laptop GPU
...
max:
...
NVIDIA GeForce RTX 4090 Laptop GPU
max:
» With all tested laptops playable in detail settings ultra.
Additional Benchmarks
Ultra Quality DXR 16xAF 1920x1080
93.9 [X] Aorus 17X AZF Intel Core i9-13900HX 1.6GHz
NVIDIA GeForce RTX 4090 Laptop GPU
min:
45.5 fps, max:
147.82 fps
...
NVIDIA GeForce RTX 4090 Laptop GPU
max:
...
Apple M3 Max 40-Core GPU
NVIDIA GeForce RTX 4090 Laptop GPU
max:
...
Apple M3 Max 40-Core GPU
NVIDIA GeForce RTX 4090 Laptop GPU
...
max:
143.7 144 [X] Asus ROG Ally Z1 Extreme AMD Ryzen Z1 Extreme 3.3GHz
NVIDIA GeForce RTX 4090 Laptop GPU
166 170 [X] Asus ROG Flow Z13 ACRNM Intel Core i9-13900H 1.9GHz
NVIDIA GeForce RTX 4090 Laptop GPU
172 198.6 [X] Aorus 17X AZF Intel Core i9-13900HX 1.6GHz
NVIDIA GeForce RTX 4090 Laptop GPU
max:
330.9 fps
207 208 208 [X] Alienware M18 R1 QHD Intel Core i9-13900HX 1.6GHz
NVIDIA GeForce RTX 4090 Laptop GPU
214 219 [X] MSI Raider GE78 HX 13VI Intel Core i9-13980HX 1.6GHz
NVIDIA GeForce RTX 4090 Laptop GPU
228 271 ~ 196 fps
+ Compare
- Hide Comparison
...
Apple M3 Max 40-Core GPU
NVIDIA GeForce RTX 4090 Laptop GPU
...
max:
121.2 134 [X] Asus ROG Ally Z1 Extreme AMD Ryzen Z1 Extreme 3.3GHz
NVIDIA GeForce RTX 4090 Laptop GPU
135 150 159 [X] Asus ROG Flow Z13 ACRNM Intel Core i9-13900H 1.9GHz
NVIDIA GeForce RTX 4090 Laptop GPU
min:
152 fps, max:
325 fps
162.5 [X] Aorus 17X AZF Intel Core i9-13900HX 1.6GHz
NVIDIA GeForce RTX 4090 Laptop GPU
max:
299.8 fps
168 175 175 [X] Alienware M18 R1 QHD Intel Core i9-13900HX 1.6GHz
NVIDIA GeForce RTX 4090 Laptop GPU
185 187 187 [X] MSI Raider GE78 HX 13VI Intel Core i9-13980HX 1.6GHz
NVIDIA GeForce RTX 4090 Laptop GPU
190 199 ~ 166 fps
+ Compare
- Hide Comparison
...
Apple M3 Max 40-Core GPU
NVIDIA GeForce RTX 4090 Laptop GPU
...
max:
73 81 [X] Asus ROG Ally Z1 Extreme AMD Ryzen Z1 Extreme 3.3GHz
NVIDIA GeForce RTX 4090 Laptop GPU
87.3 90 95 [X] Asus ROG Flow Z13 ACRNM Intel Core i9-13900H 1.9GHz
NVIDIA GeForce RTX 4090 Laptop GPU
min:
79 fps, max:
141 fps
95.2 [X] Aorus 17X AZF Intel Core i9-13900HX 1.6GHz
NVIDIA GeForce RTX 4090 Laptop GPU
max:
146.7 fps
102 [X] MSI Raider GE78 HX 13VI Intel Core i9-13980HX 1.6GHz
NVIDIA GeForce RTX 4090 Laptop GPU
103 103 103 [X] Alienware M18 R1 QHD Intel Core i9-13900HX 1.6GHz
NVIDIA GeForce RTX 4090 Laptop GPU
104 104 120 ~ 97 fps
+ Compare
- Hide Comparison
...
NVIDIA GeForce RTX 4090 Laptop GPU
...
max:
» With all tested laptops playable in detail settings ultra.
Additional Benchmarks
Lowest Preset 1920x1080
250 [X] Aorus 17X AZF Intel Core i9-13900HX 1.6GHz
NVIDIA GeForce RTX 4090 Laptop GPU
max:
399.6 fps
432 439 [X] Eurocom Raptor X17 1.47.22.14 D3D12
Intel Core i9-13900HX 1.6GHz
NVIDIA GeForce RTX 4090 Laptop GPU
min:
147 fps, P1:
263 fps, max:
617 fps
439 [X] Lenovo Legion Pro 7 RTX4090 1.47.22.14 D3D12
Intel Core i9-13900HX 1.6GHz
NVIDIA GeForce RTX 4090 Laptop GPU
min:
122.5 fps, P1:
313 fps, max:
651 fps
445 475 [X] Alienware m18 R1 1.47.22.14 D3D12
Intel Core i9-13980HX 1.6GHz
NVIDIA GeForce RTX 4090 Laptop GPU
min:
108.5 fps, P1:
369 fps, max:
666 fps
482 487 [X] Lenovo Legion 9 16IRX8 1.47.22.14 D3D12
Intel Core i9-13980HX 1.6GHz
NVIDIA GeForce RTX 4090 Laptop GPU
min:
126.5 fps, P1:
372 fps, max:
655 fps
490 [X] MSI Titan GT77 HX 13VI 1.47.22.14 D3D12
Intel Core i9-13950HX 1.6GHz
NVIDIA GeForce RTX 4090 Laptop GPU
min:
190.6 fps, P1:
374 fps, max:
657 fps
491 [X] MSI Raider GE78 HX 13VI 1.47.22.14 D3D12
Intel Core i9-13980HX 1.6GHz
NVIDIA GeForce RTX 4090 Laptop GPU
min:
138.5 fps, P1:
370 fps, max:
669 fps
496 515 [X] Medion Erazer Beast X40 1.47.22.14 D3D12
Intel Core i9-13900HX 1.6GHz
NVIDIA GeForce RTX 4090 Laptop GPU
min:
173.3 fps, P1:
397 fps, max:
664 fps
518 527 [X] Aorus 17X AZF 1.47.22.14 D3D12
Intel Core i9-13900HX 1.6GHz
NVIDIA GeForce RTX 4090 Laptop GPU
min:
180.8 fps, P1:
403 fps, max:
716 fps
558 656 [X] Eluktronics Mech-17 GP2 1.47.22.14 D3D12
Intel Core i9-13900HX 1.6GHz
NVIDIA GeForce RTX 4090 Laptop GPU
min:
17.2 fps, P1:
514 fps, max:
922 fps
~ 497 fps
+ Compare
- Hide Comparison
...
NVIDIA GeForce RTX 4090 Laptop GPU
max:
351 [X] Eurocom Raptor X17 1.47.22.14 D3D12
Intel Core i9-13900HX 1.6GHz
NVIDIA GeForce RTX 4090 Laptop GPU
min:
91.2 fps, P1:
214 fps, max:
525 fps
357 369 [X] Lenovo Legion Pro 7 RTX4090 1.47.22.14 D3D12
Intel Core i9-13900HX 1.6GHz
NVIDIA GeForce RTX 4090 Laptop GPU
min:
54.7 fps, P1:
262 fps, max:
556 fps
380 387 [X] Medion Erazer Beast X40 1.47.22.14 D3D12
Intel Core i9-13900HX 1.6GHz
NVIDIA GeForce RTX 4090 Laptop GPU
min:
137.7 fps, P1:
287 fps, max:
581 fps
388 [X] Alienware m18 R1 1.47.22.14 D3D12
Intel Core i9-13980HX 1.6GHz
NVIDIA GeForce RTX 4090 Laptop GPU
min:
107.3 fps, P1:
288 fps, max:
561 fps
396 [X] MSI Titan GT77 HX 13VI 1.47.22.14 D3D12
Intel Core i9-13950HX 1.6GHz
NVIDIA GeForce RTX 4090 Laptop GPU
min:
105.4 fps, P1:
296 fps, max:
563 fps
396 400 403 404 [X] MSI Raider GE78 HX 13VI 1.47.22.14 D3D12
Intel Core i9-13980HX 1.6GHz
NVIDIA GeForce RTX 4090 Laptop GPU
min:
76.8 fps, P1:
294 fps, max:
575 fps
409 [X] Lenovo Legion 9 16IRX8 1.47.22.14 D3D12
Intel Core i9-13980HX 1.6GHz
NVIDIA GeForce RTX 4090 Laptop GPU
min:
79 fps, P1:
310 fps, max:
581 fps
437 441 [X] Aorus 17X AZF 1.47.22.14 D3D12
Intel Core i9-13900HX 1.6GHz
NVIDIA GeForce RTX 4090 Laptop GPU
min:
164.4 fps, P1:
310 fps, max:
614 fps
508 [X] Eluktronics Mech-17 GP2 1.47.22.14 D3D12
Intel Core i9-13900HX 1.6GHz
NVIDIA GeForce RTX 4090 Laptop GPU
min:
213 fps, P1:
319 fps, max:
779 fps
~ 402 fps
+ Compare
- Hide Comparison
...
NVIDIA GeForce RTX 4090 Laptop GPU
max:
243 [X] Asus ROG Ally Z1 Extreme 1.47.22.14 D3D12
AMD Ryzen Z1 Extreme 3.3GHz
NVIDIA GeForce RTX 4090 Laptop GPU
min:
66 fps, P1:
166.5 fps, max:
410 fps
306 341 [X] Eurocom Raptor X17 1.47.22.14 D3D12
Intel Core i9-13900HX 1.6GHz
NVIDIA GeForce RTX 4090 Laptop GPU
min:
92.9 fps, P1:
211 fps, max:
501 fps
343 350 359 [X] Lenovo Legion Pro 7 RTX4090 1.47.22.14 D3D12
Intel Core i9-13900HX 1.6GHz
NVIDIA GeForce RTX 4090 Laptop GPU
min:
191.6 fps, P1:
257 fps, max:
548 fps
369 [X] Medion Erazer Beast X40 1.47.22.14 D3D12
Intel Core i9-13900HX 1.6GHz
NVIDIA GeForce RTX 4090 Laptop GPU
min:
136.6 fps, P1:
282 fps, max:
527 fps
370 372 386 388 [X] Alienware m18 R1 1.47.22.14 D3D12
Intel Core i9-13980HX 1.6GHz
NVIDIA GeForce RTX 4090 Laptop GPU
min:
97.1 fps, P1:
295 fps, max:
554 fps
390 [X] Lenovo Legion 9 16IRX8 1.47.22.14 D3D12
Intel Core i9-13980HX 1.6GHz
NVIDIA GeForce RTX 4090 Laptop GPU
min:
42.5 fps, P1:
289 fps, max:
543 fps
391 [X] MSI Titan GT77 HX 13VI 1.47.22.14 D3D12
Intel Core i9-13950HX 1.6GHz
NVIDIA GeForce RTX 4090 Laptop GPU
min:
72.1 fps, P1:
298 fps, max:
573 fps
394 [X] MSI Raider GE78 HX 13VI 1.47.22.14 D3D12
Intel Core i9-13980HX 1.6GHz
NVIDIA GeForce RTX 4090 Laptop GPU
min:
81.9 fps, P1:
294 fps, max:
570 fps
408 [X] SCHENKER XMG Neo 16 E23 1.47.22.14 D3D12
Intel Core i9-13900HX 1.6GHz
NVIDIA GeForce RTX 4090 Laptop GPU
min:
124.2 fps, P1:
300 fps, max:
626 fps
410 414 [X] Aorus 17X AZF 1.47.22.14 D3D12
Intel Core i9-13900HX 1.6GHz
NVIDIA GeForce RTX 4090 Laptop GPU
min:
43.1 fps, P1:
305 fps, max:
599 fps
460 465 [X] Eluktronics Mech-17 GP2 1.47.22.14 D3D12
Intel Core i9-13900HX 1.6GHz
NVIDIA GeForce RTX 4090 Laptop GPU
min:
14.7 fps, P1:
337 fps, max:
716 fps
~ 377 fps
+ Compare
- Hide Comparison
...
NVIDIA GeForce RTX 4090 Laptop GPU
...
max:
233 [X] Asus ROG Ally Z1 Extreme 1.47.22.14 D3D12
AMD Ryzen Z1 Extreme 3.3GHz
NVIDIA GeForce RTX 4090 Laptop GPU
min:
66.3 fps, P1:
145.5 fps, max:
367 fps
260 [X] Asus ROG Flow Z13 ACRNM 1.47.22.14 D3D12
Intel Core i9-13900H 1.9GHz
NVIDIA GeForce RTX 4090 Laptop GPU
min:
41.1 fps, P1:
122.2 fps, max:
437 fps
274 315 328 328 [X] Eurocom Raptor X17 1.47.22.14 D3D12
Intel Core i9-13900HX 1.6GHz
NVIDIA GeForce RTX 4090 Laptop GPU
min:
52.4 fps, P1:
204 fps, max:
479 fps
333 345 [X] Asus ROG Strix Scar 18 2023 G834JY-N6005W 1.47.22.14 D3D12
Intel Core i9-13980HX 1.6GHz
NVIDIA GeForce RTX 4090 Laptop GPU
min:
59.4 fps, P1:
242 fps, max:
550 fps
347 [X] Lenovo Legion Pro 7 RTX4090 1.47.22.14 D3D12
Intel Core i9-13900HX 1.6GHz
NVIDIA GeForce RTX 4090 Laptop GPU
min:
87.7 fps, P1:
252 fps, max:
531 fps
350 365 [X] Medion Erazer Beast X40 1.47.22.14 D3D12
Intel Core i9-13900HX 1.6GHz
NVIDIA GeForce RTX 4090 Laptop GPU
min:
90.9 fps, P1:
268 fps, max:
525 fps
366 373 [X] MSI Titan GT77 HX 13VI 1.47.22.14 D3D12
Intel Core i9-13950HX 1.6GHz
NVIDIA GeForce RTX 4090 Laptop GPU
min:
29.9 fps, P1:
272 fps, max:
550 fps
373 [X] Alienware m18 R1 1.47.22.14 D3D12
Intel Core i9-13980HX 1.6GHz
NVIDIA GeForce RTX 4090 Laptop GPU
min:
73.3 fps, P1:
273 fps, max:
539 fps
376 [X] Medion Erazer Beast X40 1.47.22.14 D3D12, dGPU
Intel Core i9-13900HX 1.6GHz
NVIDIA GeForce RTX 4090 Laptop GPU
min:
53.4 fps, P1:
284 fps, max:
534 fps
378 [X] Medion Erazer Beast X40 1.47.22.14 D3D12, dGPU, Cooling
Intel Core i9-13900HX 1.6GHz
NVIDIA GeForce RTX 4090 Laptop GPU
min:
79.8 fps, P1:
269 fps, max:
576 fps
378 378 [X] MSI Raider GE78 HX 13VI 1.47.22.14 D3D12
Intel Core i9-13980HX 1.6GHz
NVIDIA GeForce RTX 4090 Laptop GPU
min:
54.7 fps, P1:
251 fps, max:
547 fps
384 [X] SCHENKER XMG Neo 16 E23 1.47.22.14 D3D12
Intel Core i9-13900HX 1.6GHz
NVIDIA GeForce RTX 4090 Laptop GPU
min:
116.1 fps, P1:
281 fps, max:
564 fps
386 [X] Aorus 17X AZF 1.47.22.14 D3D12
Intel Core i9-13900HX 1.6GHz
NVIDIA GeForce RTX 4090 Laptop GPU
min:
35.7 fps, P1:
279 fps, max:
616 fps
387 [X] Lenovo Legion 9 16IRX8 1.47.22.14 D3D12
Intel Core i9-13980HX 1.6GHz
NVIDIA GeForce RTX 4090 Laptop GPU
min:
23.7 fps, P1:
277 fps, max:
568 fps
420 421 [X] Eluktronics Mech-17 GP2 1.47.22.14 D3D12
Intel Core i9-13900HX 1.6GHz
NVIDIA GeForce RTX 4090 Laptop GPU
min:
15.4 fps, P1:
302 fps, max:
693 fps
~ 352 fps
+ Compare
- Hide Comparison
...
NVIDIA GeForce RTX 4090 Laptop GPU
...
max:
217 [X] Asus ROG Ally Z1 Extreme 1.47.22.14 D3D12
AMD Ryzen Z1 Extreme 3.3GHz
NVIDIA GeForce RTX 4090 Laptop GPU
min:
100.6 fps, P1:
142.6 fps, max:
360 fps
218 255 256 257 258 [X] Asus ROG Flow Z13 ACRNM 1.47.22.14 D3D12
Intel Core i9-13900H 1.9GHz
NVIDIA GeForce RTX 4090 Laptop GPU
min:
46 fps, P1:
185.8 fps, max:
423 fps
279 [X] Medion Erazer Beast X40 1.47.22.14 D3D12, dGPU, Cooling
Intel Core i9-13900HX 1.6GHz
NVIDIA GeForce RTX 4090 Laptop GPU
min:
51 fps, P1:
215 fps, max:
461 fps
291 292 292 [X] Medion Erazer Beast X40 1.47.22.14 D3D12
Intel Core i9-13900HX 1.6GHz
NVIDIA GeForce RTX 4090 Laptop GPU
min:
98 fps, P1:
215 fps, max:
464 fps
294 [X] SCHENKER XMG Neo 16 E23 1.47.22.14 D3D12
Intel Core i9-13900HX 1.6GHz
NVIDIA GeForce RTX 4090 Laptop GPU
min:
130.6 fps, P1:
226 fps, max:
510 fps
300 [X] Aorus 17X AZF 1.47.22.14 D3D12
Intel Core i9-13900HX 1.6GHz
NVIDIA GeForce RTX 4090 Laptop GPU
min:
42.6 fps, P1:
233 fps, max:
467 fps
300 [X] Eurocom Raptor X17 1.47.22.14 D3D12
Intel Core i9-13900HX 1.6GHz
NVIDIA GeForce RTX 4090 Laptop GPU
min:
96.3 fps, P1:
196.1 fps, max:
502 fps
302 [X] Lenovo Legion Pro 7 RTX4090 1.47.22.14 D3D12
Intel Core i9-13900HX 1.6GHz
NVIDIA GeForce RTX 4090 Laptop GPU
min:
39.2 fps, P1:
226 fps, max:
492 fps
308 [X] Alienware m18 R1 1.47.22.14 D3D12
Intel Core i9-13980HX 1.6GHz
NVIDIA GeForce RTX 4090 Laptop GPU
min:
67.2 fps, P1:
238 fps, max:
520 fps
309 [X] MSI Titan GT77 HX 13VI 1.47.22.14 D3D12
Intel Core i9-13950HX 1.6GHz
NVIDIA GeForce RTX 4090 Laptop GPU
min:
143.5 fps, P1:
236 fps, max:
545 fps
309 [X] Medion Erazer Beast X40 1.47.22.14 D3D12, dGPU
Intel Core i9-13900HX 1.6GHz
NVIDIA GeForce RTX 4090 Laptop GPU
min:
21.2 fps, P1:
230 fps, max:
483 fps
311 311 [X] MSI Raider GE78 HX 13VI 1.47.22.14 D3D12
Intel Core i9-13980HX 1.6GHz
NVIDIA GeForce RTX 4090 Laptop GPU
min:
43.3 fps, P1:
238 fps, max:
488 fps
312 [X] Lenovo Legion 9 16IRX8 1.47.22.14 D3D12
Intel Core i9-13980HX 1.6GHz
NVIDIA GeForce RTX 4090 Laptop GPU
min:
28.2 fps, P1:
223 fps, max:
504 fps
315 [X] Eluktronics Mech-17 GP2 1.47.22.14 D3D12
Intel Core i9-13900HX 1.6GHz
NVIDIA GeForce RTX 4090 Laptop GPU
min:
16.8 fps, P1:
242 fps, max:
576 fps
318 ~ 287 fps
+ Compare
- Hide Comparison
...
NVIDIA GeForce RTX 4090 Laptop GPU
max:
126.3 127.8 [X] Asus ROG Ally Z1 Extreme 1.47.22.14 D3D12
AMD Ryzen Z1 Extreme 3.3GHz
NVIDIA GeForce RTX 4090 Laptop GPU
min:
55.6 fps, P1:
109.9 fps, max:
209 fps
129.5 134.7 [X] Asus ROG Flow Z13 ACRNM 1.47.22.14 D3D12
Intel Core i9-13900H 1.9GHz
NVIDIA GeForce RTX 4090 Laptop GPU
min:
24 fps, P1:
92.4 fps, max:
280 fps
153.4 154.6 [X] Aorus 17X AZF 1.47.22.14 D3D12
Intel Core i9-13900HX 1.6GHz
NVIDIA GeForce RTX 4090 Laptop GPU
min:
37.9 fps, P1:
133.6 fps, max:
589 fps
154.7 155.2 [X] Eurocom Raptor X17 1.47.22.14 D3D12
Intel Core i9-13900HX 1.6GHz
NVIDIA GeForce RTX 4090 Laptop GPU
min:
102.6 fps, P1:
132.1 fps, max:
279 fps
158.4 [X] Lenovo Legion Pro 7 RTX4090 1.47.22.14 D3D12
Intel Core i9-13900HX 1.6GHz
NVIDIA GeForce RTX 4090 Laptop GPU
min:
15.1 fps, P1:
137.7 fps, max:
325 fps
159.3 [X] MSI Titan GT77 HX 13VI 1.47.22.14 D3D12
Intel Core i9-13950HX 1.6GHz
NVIDIA GeForce RTX 4090 Laptop GPU
min:
50.2 fps, P1:
138.7 fps, max:
440 fps
159.8 [X] Alienware m18 R1 1.47.22.14 D3D12
Intel Core i9-13980HX 1.6GHz
NVIDIA GeForce RTX 4090 Laptop GPU
min:
133.4 fps, P1:
139.2 fps, max:
272 fps
160.3 161 163.4 [X] Eluktronics Mech-17 GP2 1.47.22.14 D3D12
Intel Core i9-13900HX 1.6GHz
NVIDIA GeForce RTX 4090 Laptop GPU
min:
15.7 fps, P1:
141.8 fps, max:
520 fps
298 [X] MSI Raider GE78 HX 13VI 1.47.22.14 D3D12
Intel Core i9-13980HX 1.6GHz
NVIDIA GeForce RTX 4090 Laptop GPU
min:
21.9 fps, P1:
232 fps, max:
485 fps
~ 160 fps
+ Compare
- Hide Comparison
...
NVIDIA GeForce RTX 4090 Laptop GPU
...
max:
» With all tested laptops playable in detail settings ultra.
0 100 200 Tooltip 17X AZF: Ø186.1 (126-235)
Legion 9 16IRX8: Ø195.3 (141-248)
ROG Strix Scar 18 2023 G834JY-N6005W: Ø196.8 (151-247)
Erazer Beast X40: Ø198.6 (148-251)
...
NVIDIA GeForce RTX 4090 Laptop GPU
max:
0 100 200 Tooltip Blade 16 Early 2023 RTX 4090: Ø161.8 (115-220)
17X AZF: Ø170.3 (127-211)
Erazer Beast X40: Ø172.4 (127-222)
Legion 9 16IRX8: Ø175.7 (125-229)
ROG Strix Scar 18 2023 G834JY-N6005W: Ø181.4 (143-240)
...
NVIDIA GeForce RTX 4090 Laptop GPU
max:
0 100 200 Tooltip 17X AZF: Ø160.8 (124-202)
Erazer Beast X40: Ø166.6 (126-217)
Blade 16 Early 2023 RTX 4090: Ø167.1 (121-213)
Legion 9 16IRX8: Ø167.4 (110-211)
ROG Strix Scar 18 2023 G834JY-N6005W: Ø171.7 (123-217)
XMG Neo 16 E23: Ø181 (110-242)
...
NVIDIA GeForce RTX 4090 Laptop GPU
max:
0 100 200 Tooltip Blade 16 Early 2023 RTX 4090: Ø144.4 (98-189)
ROG Strix Scar 18 2023 G834JY-N6005W: Ø158.5 (117-209)
Erazer Beast X40: Ø157.7 (114-209)
Legion 9 16IRX8: Ø157.5 (102-213)
17X AZF: Ø161.9 (119-213)
XMG Neo 16 E23: Ø167.3 (119-228)
...
NVIDIA GeForce RTX 4090 Laptop GPU
...
max:
0 100 200 Tooltip Blade 16 Early 2023 RTX 4090: Ø145.7 (102-183)
Erazer Beast X40: Ø150.8 (107-206)
Erazer Beast X40: Ø150.8 (107-206)
Erazer Beast X40: Ø150.8 (107-206)
17X AZF: Ø152.4 (114-203)
ROG Strix Scar 18 2023 G834JY-N6005W: Ø152.6 (107-197)
Legion 9 16IRX8: Ø157.2 (111-208)
XMG Neo 16 E23: Ø162.7 (111-223)
...
NVIDIA GeForce RTX 4090 Laptop GPU
max:
0 100 Tooltip 17X AZF: Ø98.1 (84-112)
Blade 16 Early 2023 RTX 4090: Ø100.2 (84-119)
ROG Strix Scar 18 2023 G834JY-N6005W: Ø107 (95-126)
...
NVIDIA GeForce RTX 4090 Laptop GPU
...
max:
» With all tested laptops playable in detail settings ultra.
Additional Benchmarks
Low Preset TAA 1920x1080
186 [X] Aorus 17X AZF Intel Core i9-13900HX 1.6GHz
NVIDIA GeForce RTX 4090 Laptop GPU
min:
142 fps, max:
236 fps
113.6 [X] Asus ROG Ally Z1 Extreme AMD Ryzen Z1 Extreme 3.3GHz
NVIDIA GeForce RTX 4090 Laptop GPU
121.3 132.2 154.4 [X] Asus ROG Flow Z13 ACRNM Intel Core i9-13900H 1.9GHz
NVIDIA GeForce RTX 4090 Laptop GPU
177.2 177.5 180.8 187.1 191.2 [X] MSI Raider GE78 HX 13VI Intel Core i9-13980HX 1.6GHz
NVIDIA GeForce RTX 4090 Laptop GPU
192.9 195.9 [X] Aorus 17X AZF Intel Core i9-13900HX 1.6GHz
NVIDIA GeForce RTX 4090 Laptop GPU
196.3 197.3 201 203 204 204 205 [X] MSI Titan GT77 HX 13VI Intel Core i9-13980HX 1.6GHz
NVIDIA GeForce RTX 4090 Laptop GPU
205 [X] MSI Titan GT77 HX 13VI Intel Core i9-13980HX 1.6GHz
NVIDIA GeForce RTX 4090 Laptop GPU
205 [X] Medion Erazer Beast X40 dGPU, Cooling
Intel Core i9-13900HX 1.6GHz
NVIDIA GeForce RTX 4090 Laptop GPU
206 [X] Medion Erazer Beast X40 dGPU
Intel Core i9-13900HX 1.6GHz
NVIDIA GeForce RTX 4090 Laptop GPU
207 208 [X] Asus ROG Strix Scar 18 2023 G834JY-N6005W Intel Core i9-13980HX 1.6GHz
NVIDIA GeForce RTX 4090 Laptop GPU
209 210 211 212 214 ~ 190 fps
+ Compare
- Hide Comparison
...
NVIDIA GeForce RTX 4090 Laptop GPU
...
max:
99.5 [X] Asus ROG Ally Z1 Extreme AMD Ryzen Z1 Extreme 3.3GHz
NVIDIA GeForce RTX 4090 Laptop GPU
105.2 118 126.5 [X] Asus ROG Flow Z13 ACRNM Intel Core i9-13900H 1.9GHz
NVIDIA GeForce RTX 4090 Laptop GPU
154.7 155.7 162.9 164.5 [X] MSI Raider GE78 HX 13VI Intel Core i9-13980HX 1.6GHz
NVIDIA GeForce RTX 4090 Laptop GPU
171.7 172.1 172.1 173.5 [X] Aorus 17X AZF Intel Core i9-13900HX 1.6GHz
NVIDIA GeForce RTX 4090 Laptop GPU
177.5 177.6 [X] Medion Erazer Beast X40 dGPU
Intel Core i9-13900HX 1.6GHz
NVIDIA GeForce RTX 4090 Laptop GPU
177.7 [X] Medion Erazer Beast X40 dGPU, Cooling
Intel Core i9-13900HX 1.6GHz
NVIDIA GeForce RTX 4090 Laptop GPU
177.7 178.1 [X] MSI Titan GT77 HX 13VI Intel Core i9-13980HX 1.6GHz
NVIDIA GeForce RTX 4090 Laptop GPU
178.7 179.4 [X] MSI Titan GT77 HX 13VI Intel Core i9-13980HX 1.6GHz
NVIDIA GeForce RTX 4090 Laptop GPU
179.5 179.7 179.8 183.8 [X] Asus ROG Strix Scar 18 2023 G834JY-N6005W Intel Core i9-13980HX 1.6GHz
NVIDIA GeForce RTX 4090 Laptop GPU
185.9 186.8 187.1 188.8 190.3 ~ 167 fps
+ Compare
- Hide Comparison
...
NVIDIA GeForce RTX 4090 Laptop GPU
...
max:
77.8 [X] Asus ROG Ally Z1 Extreme AMD Ryzen Z1 Extreme 3.3GHz
NVIDIA GeForce RTX 4090 Laptop GPU
82.7 94.3 100.7 [X] Asus ROG Flow Z13 ACRNM Intel Core i9-13900H 1.9GHz
NVIDIA GeForce RTX 4090 Laptop GPU
116.4 117.8 126.4 [X] MSI Raider GE78 HX 13VI Intel Core i9-13980HX 1.6GHz
NVIDIA GeForce RTX 4090 Laptop GPU
128.3 133 [X] SCHENKER XMG Neo 16 E23 Intel Core i9-13900HX 1.6GHz
NVIDIA GeForce RTX 4090 Laptop GPU
134.1 134.2 134.3 [X] MSI Titan GT77 HX 13VI Intel Core i9-13980HX 1.6GHz
NVIDIA GeForce RTX 4090 Laptop GPU
135 [X] MSI Titan GT77 HX 13VI Intel Core i9-13980HX 1.6GHz
NVIDIA GeForce RTX 4090 Laptop GPU
135.5 135.6 135.7 136.2 136.4 136.6 [X] Medion Erazer Beast X40 dGPU, Cooling
Intel Core i9-13900HX 1.6GHz
NVIDIA GeForce RTX 4090 Laptop GPU
136.6 136.8 [X] Medion Erazer Beast X40 dGPU
Intel Core i9-13900HX 1.6GHz
NVIDIA GeForce RTX 4090 Laptop GPU
137 138.5 [X] Aorus 17X AZF Intel Core i9-13900HX 1.6GHz
NVIDIA GeForce RTX 4090 Laptop GPU
140.1 141.4 [X] Asus ROG Strix Scar 18 2023 G834JY-N6005W Intel Core i9-13980HX 1.6GHz
NVIDIA GeForce RTX 4090 Laptop GPU
142.8 143.5 146.4 166.2 ~ 130 fps
+ Compare
- Hide Comparison
...
NVIDIA GeForce RTX 4090 Laptop GPU
...
max:
...
NVIDIA GeForce RTX 4090 Laptop GPU
...
max:
» With all tested laptops playable in detail settings high.
...
NVIDIA GeForce RTX 4090 Laptop GPU
...
max:
...
NVIDIA GeForce RTX 4090 Laptop GPU
...
max:
0 100 200 Tooltip XMG Neo 16 Raptor Lake: Ø180.7 (119-220)
...
NVIDIA GeForce RTX 4090 Laptop GPU
...
max:
113 115.7 129.5 132.7 [X] Asus ROG Ally Z1 Extreme 1.3
AMD Ryzen Z1 Extreme 3.3GHz
NVIDIA GeForce RTX 4090 Laptop GPU
135.1 [X] Asus ROG Flow Z13 ACRNM 1.3
Intel Core i9-13900H 1.9GHz
NVIDIA GeForce RTX 4090 Laptop GPU
136.8 [X] Asus ROG Strix Scar 18 2023 G834JY-N6005W 1.3
Intel Core i9-13980HX 1.6GHz
NVIDIA GeForce RTX 4090 Laptop GPU
142.1 146 [X] Medion Erazer Beast X40 1.3, dGPU, Cooling
Intel Core i9-13900HX 1.6GHz
NVIDIA GeForce RTX 4090 Laptop GPU
146.7 146.7 148.2 [X] Medion Erazer Beast X40 1.3, dGPU
Intel Core i9-13900HX 1.6GHz
NVIDIA GeForce RTX 4090 Laptop GPU
149 151 151.2 152.4 [X] Aorus 17X AZF 1.3
Intel Core i9-13900HX 1.6GHz
NVIDIA GeForce RTX 4090 Laptop GPU
154 155.9 [X] SCHENKER XMG Neo 16 E23 1.3
Intel Core i9-13900HX 1.6GHz
NVIDIA GeForce RTX 4090 Laptop GPU
156.4 157.1 158 158.4 159.3 [X] MSI Raider GE78 HX 13VI 1.3
Intel Core i9-13980HX 1.6GHz
NVIDIA GeForce RTX 4090 Laptop GPU
159.5 162.9 ~ 147 fps
+ Compare
- Hide Comparison
+ 📈 Graph
- 📈 Hide Graph
0 100 200 Tooltip XMG Neo 16 Raptor Lake: Ø158 (115-214)
...
NVIDIA GeForce RTX 4090 Laptop GPU
max:
NVIDIA RTX 6000 Ada Generation
0 100 Tooltip XMG Neo 16 Raptor Lake: Ø91.5 (60-134)
...
NVIDIA GeForce RTX 4090 Laptop GPU
max:
» With all tested laptops playable in detail settings high.
...
NVIDIA GeForce RTX 4090 Laptop GPU
» With all tested laptops playable in detail settings ultra.
138.1 [X] Asus ROG Ally Z1 Extreme AMD Ryzen Z1 Extreme 3.3GHz
NVIDIA GeForce RTX 4090 Laptop GPU
min:
123.5 fps, max:
-1 fps
164.8 [X] Asus ROG Flow Z13 ACRNM Intel Core i9-13900H 1.9GHz
NVIDIA GeForce RTX 4090 Laptop GPU
min:
8.8 fps, max:
-1 fps
165.6 166.5 192.9 215 217 [X] MSI Raider GE78 HX 13VI Intel Core i9-13980HX 1.6GHz
NVIDIA GeForce RTX 4090 Laptop GPU
min:
176.9 fps, max:
-1 fps
225 227 227 227 [X] Medion Erazer Beast X40 dGPU, Cooling
Intel Core i9-13900HX 1.6GHz
NVIDIA GeForce RTX 4090 Laptop GPU
min:
193.1 fps, max:
-1 fps
229 [X] Medion Erazer Beast X40 dGPU
Intel Core i9-13900HX 1.6GHz
NVIDIA GeForce RTX 4090 Laptop GPU
min:
195.4 fps, max:
-1 fps
230 231 234 [X] Asus ROG Strix Scar 18 2023 G834JY-N6005W Intel Core i9-13980HX 1.6GHz
NVIDIA GeForce RTX 4090 Laptop GPU
min:
202.6 fps, max:
-1 fps
234 [X] Eurocom Raptor X17 Intel Core i9-13900HX 1.6GHz
NVIDIA GeForce RTX 4090 Laptop GPU
min:
201.2 fps, max:
-1 fps
234.8 235.6 [X] Aorus 17X AZF Intel Core i9-13900HX 1.6GHz
NVIDIA GeForce RTX 4090 Laptop GPU
min:
200.3 fps, max:
-1 fps
236 [X] MSI Titan GT77 HX 13VI Intel Core i9-13980HX 1.6GHz
NVIDIA GeForce RTX 4090 Laptop GPU
min:
203.8 fps, max:
-1 fps
237 243 244 251 [X] Alienware m18 R1 Intel Core i9-13980HX 1.6GHz
NVIDIA GeForce RTX 4090 Laptop GPU
min:
208.4 fps, max:
-1 fps
288 ~ 221 fps
+ Compare
- Hide Comparison
...
NVIDIA GeForce RTX 4090 Laptop GPU
...
max:
125.9 [X] Asus ROG Ally Z1 Extreme AMD Ryzen Z1 Extreme 3.3GHz
NVIDIA GeForce RTX 4090 Laptop GPU
min:
112.3 fps, max:
-1 fps
149.1 [X] Asus ROG Flow Z13 ACRNM Intel Core i9-13900H 1.9GHz
NVIDIA GeForce RTX 4090 Laptop GPU
min:
131.8 fps, max:
-1 fps
150.5 161 177.3 191.4 [X] MSI Raider GE78 HX 13VI Intel Core i9-13980HX 1.6GHz
NVIDIA GeForce RTX 4090 Laptop GPU
min:
160.9 fps, max:
-1 fps
193.5 199.8 [X] Aorus 17X AZF Intel Core i9-13900HX 1.6GHz
NVIDIA GeForce RTX 4090 Laptop GPU
min:
171.8 fps, max:
-1 fps
202 204 205 [X] Medion Erazer Beast X40 dGPU
Intel Core i9-13900HX 1.6GHz
NVIDIA GeForce RTX 4090 Laptop GPU
min:
175.7 fps, max:
-1 fps
206 207 207 [X] Eurocom Raptor X17 Intel Core i9-13900HX 1.6GHz
NVIDIA GeForce RTX 4090 Laptop GPU
min:
171.2 fps, max:
-1 fps
207 207.7 208 [X] Asus ROG Strix Scar 18 2023 G834JY-N6005W Intel Core i9-13980HX 1.6GHz
NVIDIA GeForce RTX 4090 Laptop GPU
min:
175.2 fps, max:
-1 fps
209.9 210 [X] MSI Titan GT77 HX 13VI Intel Core i9-13980HX 1.6GHz
NVIDIA GeForce RTX 4090 Laptop GPU
min:
177.3 fps, max:
-1 fps
210 [X] Medion Erazer Beast X40 dGPU, Cooling
Intel Core i9-13900HX 1.6GHz
NVIDIA GeForce RTX 4090 Laptop GPU
min:
180 fps, max:
-1 fps
216 217 220 [X] Alienware m18 R1 Intel Core i9-13980HX 1.6GHz
NVIDIA GeForce RTX 4090 Laptop GPU
min:
187.7 fps, max:
-1 fps
255 ~ 198 fps
+ Compare
- Hide Comparison
...
NVIDIA GeForce RTX 4090 Laptop GPU
...
max:
121.2 [X] Asus ROG Ally Z1 Extreme AMD Ryzen Z1 Extreme 3.3GHz
NVIDIA GeForce RTX 4090 Laptop GPU
min:
107.3 fps, max:
-1 fps
142.1 143.2 [X] Asus ROG Flow Z13 ACRNM Intel Core i9-13900H 1.9GHz
NVIDIA GeForce RTX 4090 Laptop GPU
min:
125.5 fps, max:
-1 fps
154.2 169.9 182.6 185.8 [X] MSI Raider GE78 HX 13VI Intel Core i9-13980HX 1.6GHz
NVIDIA GeForce RTX 4090 Laptop GPU
min:
153.5 fps, max:
-1 fps
191.2 191.6 [X] Aorus 17X AZF Intel Core i9-13900HX 1.6GHz
NVIDIA GeForce RTX 4090 Laptop GPU
min:
166.1 fps, max:
-1 fps
193.9 194.1 194.6 [X] Medion Erazer Beast X40 dGPU
Intel Core i9-13900HX 1.6GHz
NVIDIA GeForce RTX 4090 Laptop GPU
min:
162.7 fps, max:
-1 fps
195.3 196.1 198.1 [X] Medion Erazer Beast X40 dGPU, Cooling
Intel Core i9-13900HX 1.6GHz
NVIDIA GeForce RTX 4090 Laptop GPU
min:
164.1 fps, max:
-1 fps
199.4 [X] Eurocom Raptor X17 Intel Core i9-13900HX 1.6GHz
NVIDIA GeForce RTX 4090 Laptop GPU
min:
170.3 fps, max:
-1 fps
200.2 201.8 202 [X] Asus ROG Strix Scar 18 2023 G834JY-N6005W Intel Core i9-13980HX 1.6GHz
NVIDIA GeForce RTX 4090 Laptop GPU
min:
174.1 fps, max:
-1 fps
202 [X] MSI Titan GT77 HX 13VI Intel Core i9-13980HX 1.6GHz
NVIDIA GeForce RTX 4090 Laptop GPU
min:
168.2 fps, max:
-1 fps
202 [X] SCHENKER XMG Neo 16 E23 Intel Core i9-13900HX 1.6GHz
NVIDIA GeForce RTX 4090 Laptop GPU
min:
167.5 fps, max:
-1 fps
205 208 210 [X] Alienware m18 R1 Intel Core i9-13980HX 1.6GHz
NVIDIA GeForce RTX 4090 Laptop GPU
min:
178 fps, max:
-1 fps
244 ~ 189 fps
+ Compare
- Hide Comparison
...
NVIDIA GeForce RTX 4090 Laptop GPU
...
max:
115.7 [X] Asus ROG Ally Z1 Extreme AMD Ryzen Z1 Extreme 3.3GHz
NVIDIA GeForce RTX 4090 Laptop GPU
min:
102.3 fps, max:
-1 fps
133.9 [X] Asus ROG Flow Z13 ACRNM Intel Core i9-13900H 1.9GHz
NVIDIA GeForce RTX 4090 Laptop GPU
min:
117.4 fps, max:
-1 fps
134.1 139 160.7 171.5 176.1 [X] Aorus 17X AZF Intel Core i9-13900HX 1.6GHz
NVIDIA GeForce RTX 4090 Laptop GPU
min:
149.8 fps, max:
-1 fps
177.3 178.8 [X] MSI Raider GE78 HX 13VI Intel Core i9-13980HX 1.6GHz
NVIDIA GeForce RTX 4090 Laptop GPU
min:
148.8 fps, max:
-1 fps
179.7 182.1 182.3 [X] Medion Erazer Beast X40 dGPU
Intel Core i9-13900HX 1.6GHz
NVIDIA GeForce RTX 4090 Laptop GPU
min:
154.8 fps, max:
-1 fps
182.5 182.6 [X] SCHENKER XMG Neo 16 E23 Intel Core i9-13900HX 1.6GHz
NVIDIA GeForce RTX 4090 Laptop GPU
min:
154.9 fps, max:
-1 fps
183.5 184.5 [X] Medion Erazer Beast X40 dGPU, Cooling
Intel Core i9-13900HX 1.6GHz
NVIDIA GeForce RTX 4090 Laptop GPU
min:
155.3 fps, max:
-1 fps
184.9 [X] Eurocom Raptor X17 Intel Core i9-13900HX 1.6GHz
NVIDIA GeForce RTX 4090 Laptop GPU
min:
157.1 fps, max:
-1 fps
185.9 187.1 [X] MSI Titan GT77 HX 13VI Intel Core i9-13980HX 1.6GHz
NVIDIA GeForce RTX 4090 Laptop GPU
min:
157 fps, max:
-1 fps
187.3 [X] Asus ROG Strix Scar 18 2023 G834JY-N6005W Intel Core i9-13980HX 1.6GHz
NVIDIA GeForce RTX 4090 Laptop GPU
min:
160.7 fps, max:
-1 fps
190.2 192.5 193.1 194.2 [X] Alienware m18 R1 Intel Core i9-13980HX 1.6GHz
NVIDIA GeForce RTX 4090 Laptop GPU
min:
157.6 fps, max:
-1 fps
220 ~ 176 fps
+ Compare
- Hide Comparison
...
NVIDIA GeForce RTX 4090 Laptop GPU
...
max:
120.2 [X] Asus ROG Ally Z1 Extreme AMD Ryzen Z1 Extreme 3.3GHz
NVIDIA GeForce RTX 4090 Laptop GPU
min:
102.3 fps, max:
-1 fps
134.1 [X] Asus ROG Flow Z13 ACRNM Intel Core i9-13900H 1.9GHz
NVIDIA GeForce RTX 4090 Laptop GPU
min:
116.6 fps, max:
-1 fps
135.4 141.9 161.9 168.6 [X] MSI Raider GE78 HX 13VI Intel Core i9-13980HX 1.6GHz
NVIDIA GeForce RTX 4090 Laptop GPU
min:
133.9 fps, max:
-1 fps
170.8 175.1 175.8 [X] Aorus 17X AZF Intel Core i9-13900HX 1.6GHz
NVIDIA GeForce RTX 4090 Laptop GPU
min:
147.6 fps, max:
-1 fps
178.5 [X] Eurocom Raptor X17 Intel Core i9-13900HX 1.6GHz
NVIDIA GeForce RTX 4090 Laptop GPU
min:
147.1 fps, max:
-1 fps
178.6 178.9 179.4 179.7 [X] MSI Titan GT77 HX 13VI Intel Core i9-13980HX 1.6GHz
NVIDIA GeForce RTX 4090 Laptop GPU
min:
141.2 fps, max:
-1 fps
186.7 190.2 [X] Alienware m18 R1 Intel Core i9-13980HX 1.6GHz
NVIDIA GeForce RTX 4090 Laptop GPU
min:
152.2 fps, max:
-1 fps
205 ~ 168 fps
+ Compare
- Hide Comparison
...
NVIDIA GeForce RTX 4090 Laptop GPU
...
max:
» With all tested laptops playable in detail settings ultra.
0 100 200 300 400 500 Tooltip Blade 16 Early 2023 RTX 4090: Ø452 (402-546)
...
NVIDIA GeForce RTX 4090 Laptop GPU
max:
0 100 200 300 400 Tooltip Blade 16 Early 2023 RTX 4090: Ø408 (363-463)
...
NVIDIA GeForce RTX 4090 Laptop GPU
max:
0 100 200 300 Tooltip Blade 16 Early 2023 RTX 4090: Ø322 (273-352)
...
NVIDIA GeForce RTX 4090 Laptop GPU
max:
139.2 [X] Asus ROG Ally Z1 Extreme AMD Ryzen Z1 Extreme 3.3GHz
NVIDIA GeForce RTX 4090 Laptop GPU
min:
133 fps, P1:
134 fps, max:
149 fps
150.6 174.8 178 178.6 195 [X] Asus ROG Flow Z13 ACRNM Intel Core i9-13900H 1.9GHz
NVIDIA GeForce RTX 4090 Laptop GPU
P0.1:
68.8 fpsP1:
126.2 fps
195.1 198.9 [X] MSI Titan GT77 HX 13VI Intel Core i9-13950HX 1.6GHz
NVIDIA GeForce RTX 4090 Laptop GPU
min:
190 fps, P1:
191 fps, max:
214 fps
200 [X] Aorus 17X AZF Intel Core i9-13900HX 1.6GHz
NVIDIA GeForce RTX 4090 Laptop GPU
min:
174 fps
200 203.8 204.9 [X] Medion Erazer Beast X40 dGPU, Cooling
Intel Core i9-13900HX 1.6GHz
NVIDIA GeForce RTX 4090 Laptop GPU
min:
178 fps, max:
239 fps
206 [X] Medion Erazer Beast X40 dGPU
Intel Core i9-13900HX 1.6GHz
NVIDIA GeForce RTX 4090 Laptop GPU
P1:
178.6 fps
206 207 207.2 [X] Eurocom Raptor X17 Intel Core i9-13900HX 1.6GHz
NVIDIA GeForce RTX 4090 Laptop GPU
min:
187 fps, max:
227 fps
208.7 210 [X] SCHENKER XMG Neo 16 E23 Intel Core i9-13900HX 1.6GHz
NVIDIA GeForce RTX 4090 Laptop GPU
min:
170 fps
213.4 [X] MSI Raider GE78 HX 13VI Intel Core i9-13980HX 1.6GHz
NVIDIA GeForce RTX 4090 Laptop GPU
P0.1:
72.4 fpsP1:
144.6 fps
213.9 [X] Alienware m18 R1 Intel Core i9-13980HX 1.6GHz
NVIDIA GeForce RTX 4090 Laptop GPU
min:
205 fps, max:
226 fps
216.3 216.4 ~ 197 fps
+ Compare
- Hide Comparison
+ 📈 Graph
- 📈 Hide Graph
0 100 200 Tooltip ROG Ally Z1 Extreme: Ø139.2 (133-149)
ROG Zephyrus G14 GA402XY: Ø150.6 (142-161)
Blade 16 Early 2023 RTX 4090: Ø189.7 (166-213)
ROG Zephyrus M16 GU604VY-NM042X: Ø172.3 (160-185)
Zephyrus Duo 16 GX650PY-NM006W: Ø178.6 (172-188)
Erazer Beast X40: Ø189.4 (179-197)
Titan GT77 HX 13VI: Ø198.9 (190-214)
17X AZF: Ø199.2 (176-205)
Legion Pro 7 RTX4090: Ø196 (185-206)
ROG Strix Scar 17 G733PY-XS96: Ø196.8 (185-211)
Erazer Beast X40 dGPU, Cooling: Ø200 (186-211)
Key 17 Pro (Early 23): Ø199.1 (178-207)
Raptor X17: Ø197.9 (182-212)
Legion 9 16IRX8: Ø198.7 (181-213)
XMG Neo 16 E23: Ø205 (192-219)
m18 R1: Ø197.9 (178-214)
Mech-17 GP2: Ø207 (191-221)
XMG Neo 16 Raptor Lake: Ø204 (195-219)
...
NVIDIA GeForce RTX 4090 Laptop GPU
...
max:
NVIDIA GeForce RTX 4090 Laptop GPU
max:
0 100 Tooltip Blade 16 Early 2023 RTX 4090: Ø130 (121-142)
...
NVIDIA GeForce RTX 4090 Laptop GPU
...
max:
» With all tested laptops playable in detail settings ultra.
Additional Benchmarks
Ultra Graphics & Postprocessing (HBAO+) 3840x2160
Medium Graphics & Postprocessing 1920x1080
185 186 186.3 186.6 186.6 [X] MSI Raider GE78 HX 13VI Intel Core i9-13980HX 1.6GHz
NVIDIA GeForce RTX 4090 Laptop GPU
min:
1.523 fps, P1:
100 fps, max:
519 fps
186.7 [X] Alienware m18 R1 Intel Core i9-13980HX 1.6GHz
NVIDIA GeForce RTX 4090 Laptop GPU
min:
1.455 fps, P1:
142.9 fps, max:
517 fps
187 [X] Aorus 17X AZF Intel Core i9-13900HX 1.6GHz
NVIDIA GeForce RTX 4090 Laptop GPU
min:
2.6 fps, P1:
125 fps, max:
618 fps
187.1 [X] Lenovo Legion 9 16IRX8 Intel Core i9-13980HX 1.6GHz
NVIDIA GeForce RTX 4090 Laptop GPU
min:
1.694 fps, P1:
111.1 fps, max:
612 fps
187.2 [X] Eurocom Raptor X17 Intel Core i9-13900HX 1.6GHz
NVIDIA GeForce RTX 4090 Laptop GPU
min:
3.51 fps, P1:
166.7 fps, max:
505 fps
187.4 187.5 [X] Eluktronics Mech-17 GP2 Intel Core i9-13900HX 1.6GHz
NVIDIA GeForce RTX 4090 Laptop GPU
min:
3.95 fps, P1:
200 fps, max:
441 fps
187.5 187.7 ~ 187 fps
+ Compare
- Hide Comparison
...
NVIDIA GeForce RTX 4090 Laptop GPU
...
max:
180.4 183.1 184.1 [X] MSI Titan GT77 HX 13VI Intel Core i9-13950HX 1.6GHz
NVIDIA GeForce RTX 4090 Laptop GPU
min:
1.758 fps, P1:
111.1 fps, max:
444 fps
185 [X] MSI Raider GE78 HX 13VI Intel Core i9-13980HX 1.6GHz
NVIDIA GeForce RTX 4090 Laptop GPU
min:
2.05 fps, P1:
100 fps, max:
558 fps
185.3 [X] Alienware m18 R1 Intel Core i9-13980HX 1.6GHz
NVIDIA GeForce RTX 4090 Laptop GPU
min:
1.896 fps, P1:
125 fps, max:
502 fps
185.7 186.1 [X] Aorus 17X AZF Intel Core i9-13900HX 1.6GHz
NVIDIA GeForce RTX 4090 Laptop GPU
min:
1.711 fps, P1:
100 fps, max:
652 fps
186.3 [X] Lenovo Legion 9 16IRX8 Intel Core i9-13980HX 1.6GHz
NVIDIA GeForce RTX 4090 Laptop GPU
min:
1.83 fps, P1:
111.1 fps, max:
514 fps
186.4 [X] Eurocom Raptor X17 Intel Core i9-13900HX 1.6GHz
NVIDIA GeForce RTX 4090 Laptop GPU
min:
1.675 fps, P1:
125 fps, max:
469 fps
186.4 186.7 186.9 187.1 [X] Medion Erazer Beast X40 Intel Core i9-13900HX 1.6GHz
NVIDIA GeForce RTX 4090 Laptop GPU
min:
1.343 fps, P1:
166.7 fps, max:
486 fps
187.2 [X] Eluktronics Mech-17 GP2 Intel Core i9-13900HX 1.6GHz
NVIDIA GeForce RTX 4090 Laptop GPU
min:
2.33 fps, P1:
200 fps, max:
388 fps
187.3 ~ 186 fps
+ Compare
- Hide Comparison
...
NVIDIA GeForce RTX 4090 Laptop GPU
max:
AMD Radeon RX 7600
154.1 [X] Asus ROG Ally Z1 Extreme AMD Ryzen Z1 Extreme 3.3GHz
NVIDIA GeForce RTX 4090 Laptop GPU
min:
5.98 fps, P1:
100 fps, max:
285 fps
172.3 175.2 179.8 181.6 182.2 [X] Aorus 17X AZF Intel Core i9-13900HX 1.6GHz
NVIDIA GeForce RTX 4090 Laptop GPU
min:
3.35 fps, P1:
125 fps, max:
526 fps
182.4 182.5 [X] MSI Raider GE78 HX 13VI Intel Core i9-13980HX 1.6GHz
NVIDIA GeForce RTX 4090 Laptop GPU
min:
2.19 fps, P1:
125 fps, max:
479 fps
182.6 [X] MSI Titan GT77 HX 13VI Intel Core i9-13950HX 1.6GHz
NVIDIA GeForce RTX 4090 Laptop GPU
min:
1.92 fps, P1:
111.1 fps, max:
385 fps
183.7 [X] Eurocom Raptor X17 Intel Core i9-13900HX 1.6GHz
NVIDIA GeForce RTX 4090 Laptop GPU
min:
1.892 fps, P1:
125 fps, max:
446 fps
184.1 [X] SCHENKER XMG Neo 16 E23 Intel Core i9-13900HX 1.6GHz
NVIDIA GeForce RTX 4090 Laptop GPU
min:
1.945 fps, P1:
125 fps, max:
409 fps
184.5 [X] Alienware m18 R1 Intel Core i9-13980HX 1.6GHz
NVIDIA GeForce RTX 4090 Laptop GPU
min:
1.946 fps, P1:
142.9 fps, max:
426 fps
184.8 184.8 184.8 [X] Lenovo Legion 9 16IRX8 Intel Core i9-13980HX 1.6GHz
NVIDIA GeForce RTX 4090 Laptop GPU
min:
2.16 fps, P1:
125 fps, max:
482 fps
184.9 186 [X] Medion Erazer Beast X40 Intel Core i9-13900HX 1.6GHz
NVIDIA GeForce RTX 4090 Laptop GPU
min:
2.92 fps, P1:
166.7 fps, max:
459 fps
186.5 [X] Eluktronics Mech-17 GP2 Intel Core i9-13900HX 1.6GHz
NVIDIA GeForce RTX 4090 Laptop GPU
min:
1.93 fps, P1:
166.7 fps, max:
358 fps
187.1 ~ 181 fps
+ Compare
- Hide Comparison
...
NVIDIA GeForce RTX 4090 Laptop GPU
...
max:
91.1 [X] Asus ROG Ally Z1 Extreme AMD Ryzen Z1 Extreme 3.3GHz
NVIDIA GeForce RTX 4090 Laptop GPU
min:
7.1 fps, P1:
62.5 fps, max:
171 fps
107.8 [X] Asus ROG Flow Z13 ACRNM Intel Core i9-13900H 1.9GHz
NVIDIA GeForce RTX 4090 Laptop GPU
min:
4.77 fps, P1:
71.4 fps, max:
212 fps
112.6 114 127.7 128.7 134 135.3 [X] Aorus 17X AZF Intel Core i9-13900HX 1.6GHz
NVIDIA GeForce RTX 4090 Laptop GPU
min:
6.48 fps, P1:
90.9 fps, max:
234 fps
137.5 139.5 [X] Eurocom Raptor X17 Intel Core i9-13900HX 1.6GHz
NVIDIA GeForce RTX 4090 Laptop GPU
min:
3.44 fps, P1:
100 fps, max:
233 fps
140.9 [X] MSI Titan GT77 HX 13VI Intel Core i9-13950HX 1.6GHz
NVIDIA GeForce RTX 4090 Laptop GPU
min:
3.54 fps, P1:
83.3 fps, max:
244 fps
141.3 141.5 [X] Asus ROG Strix Scar 18 2023 G834JY-N6005W Intel Core i9-13980HX 1.6GHz
NVIDIA GeForce RTX 4090 Laptop GPU
min:
4.99 fps, P1:
90.9 fps, max:
270 fps
142 [X] MSI Raider GE78 HX 13VI Intel Core i9-13980HX 1.6GHz
NVIDIA GeForce RTX 4090 Laptop GPU
min:
2.92 fps, P1:
90.9 fps, max:
339 fps
142.3 143.6 148.2 [X] SCHENKER XMG Neo 16 E23 Intel Core i9-13900HX 1.6GHz
NVIDIA GeForce RTX 4090 Laptop GPU
min:
7.32 fps, P1:
100 fps, max:
263 fps
149 [X] Alienware m18 R1 Intel Core i9-13980HX 1.6GHz
NVIDIA GeForce RTX 4090 Laptop GPU
min:
3.13 fps, P1:
111.1 fps, max:
277 fps
149.8 [X] Eluktronics Mech-17 GP2 Intel Core i9-13900HX 1.6GHz
NVIDIA GeForce RTX 4090 Laptop GPU
min:
3.08 fps, P1:
111.1 fps, max:
279 fps
149.8 [X] Medion Erazer Beast X40 dGPU, Cooling
Intel Core i9-13900HX 1.6GHz
NVIDIA GeForce RTX 4090 Laptop GPU
min:
3.42 fps, P1:
111.1 fps, max:
305 fps
150.7 [X] Lenovo Legion 9 16IRX8 Intel Core i9-13980HX 1.6GHz
NVIDIA GeForce RTX 4090 Laptop GPU
min:
3 fps, P1:
111.1 fps, max:
327 fps
151.3 [X] Medion Erazer Beast X40 Intel Core i9-13900HX 1.6GHz
NVIDIA GeForce RTX 4090 Laptop GPU
min:
2.81 fps, P1:
111.1 fps, max:
278 fps
151.6 [X] Medion Erazer Beast X40 dGPU
Intel Core i9-13900HX 1.6GHz
NVIDIA GeForce RTX 4090 Laptop GPU
min:
4.06 fps, P1:
90.9 fps, max:
286 fps
167.7 ~ 137 fps
+ Compare
- Hide Comparison
...
NVIDIA GeForce RTX 4090 Laptop GPU
...
max:
AMD Radeon RX 7800 XT
90.4 [X] Asus ROG Ally Z1 Extreme AMD Ryzen Z1 Extreme 3.3GHz
NVIDIA GeForce RTX 4090 Laptop GPU
min:
5.02 fps, P1:
62.5 fps, max:
179 fps
105.6 [X] Asus ROG Flow Z13 ACRNM Intel Core i9-13900H 1.9GHz
NVIDIA GeForce RTX 4090 Laptop GPU
min:
16.7 fps, P1:
71.4 fps, max:
202 fps
108.9 114.8 120.5 123 123.8 132.9 [X] Aorus 17X AZF Intel Core i9-13900HX 1.6GHz
NVIDIA GeForce RTX 4090 Laptop GPU
min:
18.8 fps, P1:
90.9 fps, max:
241 fps
134.3 [X] Eurocom Raptor X17 Intel Core i9-13900HX 1.6GHz
NVIDIA GeForce RTX 4090 Laptop GPU
min:
4.11 fps, P1:
90.9 fps, max:
273 fps
136.3 [X] Medion Erazer Beast X40 dGPU, Cooling
Intel Core i9-13900HX 1.6GHz
NVIDIA GeForce RTX 4090 Laptop GPU
min:
11.3 fps, P1:
90.9 fps, max:
238 fps
137.7 137.7 138.5 [X] MSI Titan GT77 HX 13VI Intel Core i9-13950HX 1.6GHz
NVIDIA GeForce RTX 4090 Laptop GPU
min:
3.45 fps, P1:
76.9 fps, max:
256 fps
138.5 [X] MSI Raider GE78 HX 13VI Intel Core i9-13980HX 1.6GHz
NVIDIA GeForce RTX 4090 Laptop GPU
min:
4.21 fps, P1:
90.9 fps, max:
230 fps
139.1 141.5 144.1 [X] SCHENKER XMG Neo 16 E23 Intel Core i9-13900HX 1.6GHz
NVIDIA GeForce RTX 4090 Laptop GPU
min:
5.25 fps, P1:
100 fps, max:
275 fps
145.3 [X] Medion Erazer Beast X40 Intel Core i9-13900HX 1.6GHz
NVIDIA GeForce RTX 4090 Laptop GPU
min:
4.17 fps, P1:
111.1 fps, max:
257 fps
145.3 [X] Lenovo Legion 9 16IRX8 Intel Core i9-13980HX 1.6GHz
NVIDIA GeForce RTX 4090 Laptop GPU
min:
4.06 fps, P1:
100 fps, max:
332 fps
145.5 [X] Alienware m18 R1 Intel Core i9-13980HX 1.6GHz
NVIDIA GeForce RTX 4090 Laptop GPU
min:
2.46 fps, P1:
111.1 fps, max:
281 fps
146 [X] Medion Erazer Beast X40 dGPU
Intel Core i9-13900HX 1.6GHz
NVIDIA GeForce RTX 4090 Laptop GPU
min:
11.2 fps, P1:
100 fps, max:
288 fps
146.3 [X] Eluktronics Mech-17 GP2 Intel Core i9-13900HX 1.6GHz
NVIDIA GeForce RTX 4090 Laptop GPU
min:
5.49 fps, P1:
111.1 fps, max:
261 fps
160.6 ~ 133 fps
+ Compare
- Hide Comparison
...
NVIDIA GeForce RTX 4090 Laptop GPU
...
max:
88.9 143 [X] Asus ROG Ally Z1 Extreme AMD Ryzen Z1 Extreme 3.3GHz
NVIDIA GeForce RTX 4090 Laptop GPU
min:
4.05 fps, P1:
100 fps, max:
270 fps
143.3 151.3 [X] Asus ROG Flow Z13 ACRNM Intel Core i9-13900H 1.9GHz
NVIDIA GeForce RTX 4090 Laptop GPU
min:
7.54 fps, P1:
100 fps, max:
286 fps
153.5 167.9 170.5 173.6 [X] Eurocom Raptor X17 Intel Core i9-13900HX 1.6GHz
NVIDIA GeForce RTX 4090 Laptop GPU
min:
2.88 fps, P1:
111.1 fps, max:
365 fps
173.6 174.3 [X] Aorus 17X AZF Intel Core i9-13900HX 1.6GHz
NVIDIA GeForce RTX 4090 Laptop GPU
min:
3.36 fps, P1:
100 fps, max:
511 fps
175.7 [X] MSI Titan GT77 HX 13VI Intel Core i9-13950HX 1.6GHz
NVIDIA GeForce RTX 4090 Laptop GPU
min:
2.91 fps, P1:
111.1 fps, max:
424 fps
175.7 176.4 [X] Alienware m18 R1 Intel Core i9-13980HX 1.6GHz
NVIDIA GeForce RTX 4090 Laptop GPU
min:
1.959 fps, P1:
111.1 fps, max:
452 fps
180.2 [X] Eluktronics Mech-17 GP2 Intel Core i9-13900HX 1.6GHz
NVIDIA GeForce RTX 4090 Laptop GPU
min:
2.04 fps, P1:
125 fps, max:
347 fps
182.7 183.2 [X] MSI Raider GE78 HX 13VI Intel Core i9-13980HX 1.6GHz
NVIDIA GeForce RTX 4090 Laptop GPU
min:
2.92 fps, P1:
125 fps, max:
441 fps
~ 163 fps
+ Compare
- Hide Comparison
...
NVIDIA GeForce RTX 4090 Laptop GPU
...
max:
» With all tested laptops playable in detail settings ultra.
Additional Benchmarks
Highest Settings possible 16xAF 4xMSAA + FXAA 3840x2160
90 [X] Eluktronics Mech-17 GP2 959964
Intel Core i9-13900HX 1.6GHz
NVIDIA GeForce RTX 4090 Laptop GPU
min:
3.39 fps, P1:
58.8 fps, max:
158.6 fps
60.1 [X] Asus ROG Flow Z13 ACRNM Intel Core i9-13900H 1.9GHz
NVIDIA GeForce RTX 4090 Laptop GPU
min:
15.1 fps, P1:
58.8 fps, max:
131 fps
84.7 [X] Aorus 17X AZF Intel Core i9-13900HX 1.6GHz
NVIDIA GeForce RTX 4090 Laptop GPU
min:
5.57 fps, P1:
52.6 fps, max:
230 fps
86.9 [X] Alienware m18 R1 959964
Intel Core i9-13980HX 1.6GHz
NVIDIA GeForce RTX 4090 Laptop GPU
min:
3.27 fps, P1:
58.8 fps, max:
170.1 fps
85.8 [X] Eurocom Raptor X17 Intel Core i9-13900HX 1.6GHz
NVIDIA GeForce RTX 4090 Laptop GPU
min:
3.85 fps, P1:
55.6 fps, max:
192.3 fps
71.6 [X] Asus ROG Ally Z1 Extreme AMD Ryzen Z1 Extreme 3.3GHz
NVIDIA GeForce RTX 4090 Laptop GPU
min:
4.92 fps, P1:
47.6 fps, max:
116.1 fps
Normal/Off 4xAF 1920x1080
186.3 [X] SCHENKER XMG Neo 16 E23 Intel Core i9-13900HX 1.6GHz
NVIDIA GeForce RTX 4090 Laptop GPU
min:
1.595 fps, P1:
142.9 fps, max:
443 fps
186.6 [X] Aorus 17X AZF Intel Core i9-13900HX 1.6GHz
NVIDIA GeForce RTX 4090 Laptop GPU
min:
2.01 fps, P1:
100 fps, max:
640 fps
186 [X] Alienware m18 R1 959964
Intel Core i9-13980HX 1.6GHz
NVIDIA GeForce RTX 4090 Laptop GPU
min:
1.556 fps, P1:
125 fps, max:
495 fps
185.7 [X] Eurocom Raptor X17 Intel Core i9-13900HX 1.6GHz
NVIDIA GeForce RTX 4090 Laptop GPU
min:
1.362 fps, P1:
111.1 fps, max:
471 fps
185.6 [X] MSI Raider GE78 HX 13VI Intel Core i9-13980HX 1.6GHz
NVIDIA GeForce RTX 4090 Laptop GPU
min:
1.593 fps, P1:
100 fps, max:
545 fps
Lowest Settings possible 1920x1080
187.1 [X] SCHENKER XMG Neo 16 E23 Intel Core i9-13900HX 1.6GHz
NVIDIA GeForce RTX 4090 Laptop GPU
min:
1.504 fps, P1:
166.7 fps, max:
504 fps
187.3 [X] Aorus 17X AZF Intel Core i9-13900HX 1.6GHz
NVIDIA GeForce RTX 4090 Laptop GPU
min:
1.478 fps, P1:
111.1 fps, max:
718 fps
187.3 [X] Alienware m18 R1 959964
Intel Core i9-13980HX 1.6GHz
NVIDIA GeForce RTX 4090 Laptop GPU
min:
1.557 fps, P1:
200 fps, max:
504 fps
187 [X] Eurocom Raptor X17 Intel Core i9-13900HX 1.6GHz
NVIDIA GeForce RTX 4090 Laptop GPU
min:
1.442 fps, P1:
142.9 fps, max:
555 fps
186.8 [X] MSI Raider GE78 HX 13VI Intel Core i9-13980HX 1.6GHz
NVIDIA GeForce RTX 4090 Laptop GPU
min:
1.5 fps, P1:
100 fps, max:
557 fps
NVIDIA GeForce RTX 4090 Laptop GPU
NVIDIA GeForce RTX 4090 Laptop GPU
low med. high ultra QHD 4K Call of Duty Modern Warfare 3 2023 232 198 187 142 93 Alan Wake 2 134.8 133.2 124.7 85.5 46.9 Lords of the Fallen 144.7 106.3 75.9 51.9 29.1 Total War Pharaoh 317 220 177 169 96.1 Assassin's Creed Mirage 203 195 148 128 80 EA Sports FC 24 219 179.3 171.3 167.6 153.2 Counter-Strike 2 240 219 213 188.7 113.5 Cyberpunk 2077 2.0 Phantom Liberty 140 127 123 101 50 Lies of P 270 250 230 173.1 91.2 The Crew Motorfest 60 60 60 60 60 Starfield 105.4 89.3 80.5 67.2 46.5 Armored Core 6 116.3 116.1 115.4 114.7 92 Immortals of Aveum 107.5 90.6 62.9 36.6 Atlas Fallen 195.3 193.8 191.3 171.1 96.4 Baldur's Gate 3 204 186.2 176.8 133.5 66 Ratchet & Clank Rift Apart 163.4 159 136 113 103 67.6 F1 23 315 305 320 126 82 53 Diablo 4 379 374 361 334 232 123.5 Star Wars Jedi Survivor 131.2 121 111 111 83 42 Dead Island 2 226 219 199 194 188 98 The Last of Us 113.7 110.8 106 99 79 41 Resident Evil 4 Remake 218 192 180 140 111 64 Company of Heroes 3 297 272 237 225 186 117.4 Sons of the Forest 100 94 91 90 87 72.5 Atomic Heart 211 174 161 144 112 62.7 Returnal 173 172 166 147 116 70 Hogwarts Legacy 179 152 102 93 78 38 Dead Space Remake 150 146 136 135 103 55 The Witcher 3 v4.00 230 172 156 138 97 49 High On Life 277 246 211 183 123 54 The Callisto Protocol 194 177 151 131 105 64 Need for Speed Unbound 124.2 111.8 84.3 Spider-Man Miles Morales 134 131 118 110 107 78 Call of Duty Modern Warfare 2 2022 204 192 174 168 127 79 Uncharted Legacy of Thieves Collection 108.2 103.1 62.9 A Plague Tale Requiem 87.1 87 69 39 FIFA 23 183.7 182.6 162.4 The Quarry 278 211 177.3 146.1 100.2 F1 22 304 293 267 125 85 44 Vampire Bloodhunt 290 242 138.3 Ghostwire Tokyo 237 236 234 231 201 99 Tiny Tina's Wonderlands 323 269 206 173 125 67 Cyberpunk 2077 1.6 152 138 136 125 96 48 Elex 2 118.2 117.1 116.2 116.2 116.7 GRID Legends 241 220 200 191 184 130 Elden Ring 60 60 60 60 60 60 Dying Light 2 240 206 164 114 59 Rainbow Six Extraction 378 347 346 314 219 112 God of War 189 188 173 128 108 76 Halo Infinite 128.9 77 57.3 Battlefield 2042 172.6 138.9 85.4 Forza Horizon 5 220 181 174 124 113 95 Riders Republic 209 200 185 179 146 Guardians of the Galaxy 163 160 158 152 141 Back 4 Blood 403 309 309 327 Far Cry 6 175.7 161 137 122 115 80 F1 2021 512 444 355 198 172 106 Yakuza Like a Dragon 179.7 167.7 166.6 152.3 138.1 Assassin´s Creed Valhalla 175 153 124 75 Watch Dogs Legion 152 144 131 116 104 66 Mafia Definitive Edition 219 189 183 165 92 Flight Simulator 2020 74 74 51.2 Horizon Zero Dawn 197 189 174 159 150 94 Death Stranding 179 171.4 166.6 163 162.1 F1 2020 413 354 344 305 253 148.7 Hunt Showdown 367 285 262 168 Borderlands 3 231 209 188 163 127 72 Control 240 232 185 122 63 Far Cry New Dawn 170 148 145 131 128 102 Metro Exodus 211 184 154 131 115 79 Shadow of the Tomb Raider 246 223 212 196 166 97 Strange Brigade 497 402 377 352 287 160 Far Cry 5 194 183 170 158 153 102 X-Plane 11.11 190 167 130 112 Final Fantasy XV Benchmark 222 207 173 147 89 Deus Ex Mankind Divided 169 Dota 2 Reborn 221 198 189 176 168 The Witcher 3 561 485 375 197 165 143 GTA V 187 186 181 137 133 163 Counter-Strike: GO 516 314 < 30 fps < 60 fps < 120 fps ≥ 120 fps 4 51 7 60 13 58 17 55 1 35 41 1 17 42 11
For more games that might be playable and a list of all games and graphics cards visit our Gaming List
v1.26
log 15. 23:03:08
#0 no ids found in url (should be separated by "_") +0s ... 0s
#1 not redirecting to Ajax server +0s ... 0s
#2 did not recreate cache, as it is less than 5 days old! Created at Sun, 12 Nov 2023 17:14:47 +0100 +0.001s ... 0.001s
#3 composed specs +0.072s ... 0.073s
#4 did output specs +0s ... 0.073s
#5 start showIntegratedCPUs +0s ... 0.073s
#6 getting avg benchmarks for device 11437 +0.03s ... 0.103s
#7 got single benchmarks 11437 +0.073s ... 0.177s
#8 got avg benchmarks for devices +0s ... 0.177s
#9 min, max, avg, median took s +1.303s ... 1.48s
#10 before gaming benchmark output +0s ... 1.48s
#11 Got 1938 rows for game benchmarks. +0.958s ... 2.438s
#12 composed SQL query for gamebenchmarks +0s ... 2.438s
#13 got data and put it in $dataArray +0.068s ... 2.506s
#14 benchmarks composed for output. +3.687s ... 6.193s
#15 return log +0.055s ... 6.248s
Notebook reviews with NVIDIA GeForce RTX 4090 Laptop GPU graphics card
Legion 9i Gen 8 16IRX8 review: Lenovo's most ambitious gaming laptop yet After launching a handful of Legion 5 and Legion 7 options, Lenovo is finally ready to revisit its flagship Legion 9 series with the Legion 9i 16 G8. You know t...
Intel Core i9-13980HX | NVIDIA GeForce RTX 4090 Laptop GPU | 16.00" | 2.6 kg
Asus ROG Strix SCAR 17 X3D review - The world's fastest gaming laptop The ROG Strix SCAR 17 X3D is the first gaming laptop to feature AMD's newest Ryzen 9 7945HX3D processor which, for the first time ever, relies on 3D cache. Addi...
AMD Ryzen 9 7945HX3D | NVIDIA GeForce RTX 4090 Laptop GPU | 17.30" | 2.9 kg
AMD Ryzen 9 7945HX3D Zen4 analysis - The fastest mobile gaming processor thanks to 3D V-Cache In the field of desktop PCs, AMD processors with 3D cache have existed for quite some time, but the announcement of the Ryzen 9 7945HX3D marks the first mobile ...
AMD Ryzen 9 7945HX3D | NVIDIA GeForce RTX 4090 Laptop GPU | 17.30" | 2.9 kg
Lenovo Legion Pro 7 16 laptop review: Full gaming power thanks to RTX 4090 The top model of the Legion Pro 7 is designed for maximum performance. Core i9-13900HX and GeForce RTX 4090 promise smooth frame rates on the internal WQXGA dis...
Intel Core i9-13900HX | NVIDIA GeForce RTX 4090 Laptop GPU | 16.00" | 2.7 kg
Schenker Key 17 Pro (Early 23) review: 4k gaming notebook with Core i9 and RTX 4090 This 17.3-inch Schenker laptop is one of the most powerful of its kind on the market right now. Featuring a Core i9-13900HX and an RTX 4090 Laptop, the device i...
Intel Core i9-13900HX | NVIDIA GeForce RTX 4090 Laptop GPU | 17.30" | 3.4 kg
Eurocom Raptor X17 : Intel Core i9-13900HX, 17.30", 3.5 kgReview » Eurocom Raptor X17 laptop review: The MSI and Asus ROG alternative
Asus ROG Zephyrus G14 GA402XY : AMD Ryzen 9 7940HS, 14.00", 1.7 kgReview » Asus ROG Zephyrus G14 Review - Compact Gaming Laptop with AMD Zen4 Phoenix & RTX 4090
Aorus 17X AZF : Intel Core i9-13900HX, 17.30", 2.9 kgReview » Aorus 17X AZF review: High-end gaming laptop with i9-13900HX and RTX 4090 in a slim case
Eluktronics Mech-17 GP2 Liquid Propulsion Package G2 : Intel Core i9-13900HXReview » Water cooling a GeForce RTX 4090 laptop: Eluktronics Liquid Propulsion Package G2 review
Asus ROG Strix Scar 17 G733PY-XS96 : AMD Ryzen 9 7945HX, 17.30", 2.9 kgReview » Asus ROG Strix Scar 17 G733PY laptop review: Intel is no longer king
Alienware m18 R1 : Intel Core i9-13980HX, 18.00", 3.9 kgReview » Alienware m18 R1 laptop review: Bigger and heavier than the MSI Titan GT77
Asus Zephyrus Duo 16 GX650PY-NM006W : AMD Ryzen 9 7945HX, 16.00", 2.7 kgReview » AMD Ryzen 9 7945HX Analysis - Zen4 Dragon Range is faster and more efficient than Intel Raptor Lake-HX
Medion Erazer Beast X40 : Intel Core i9-13900HX, 17.00", 2.9 kgReview » Medion Erazer Beast X40 review: Gaming notebook with RTX 4090
Razer Blade 16 Early 2023 RTX 4090 : Intel Core i9-13950HX, 16.00", 2.5 kgReview » Razer Blade 16 Early 2023 RTX 4090 Review: Core i9-13950HX beast with world's first dual-mode mini-LED UHD+ display
Asus ROG Zephyrus M16 GU604VY-NM042X : Intel Core i9-13900H, 16.00", 2.3 kgReview » Asus ROG Zephyrus M16 (2023) laptop review: RTX 4090 with a super bright, Mini-LED display
Asus Zephyrus Duo 16 GX650PY-NM006W : AMD Ryzen 9 7945HX, 16.00", 2.7 kgReview » Asus ROG Zephyrus Duo 16 Notebook Review: Multitasking monster with AMD Zen4, RTX 4090 & Mini-LED
Eluktronics Mech-17 GP2 : Intel Core i9-13900HX, 17.00", 2.9 kgReview » Eluktronics Mech-17 GP2 laptop review: MSI GT77 Titan performance without the size
Asus ROG Strix Scar 18 2023 G834JY-N6005W : Intel Core i9-13980HX, 18.00", 3.1 kgReview » Asus ROG Strix Scar 18 2023 G834JY review - Gaming laptop with RTX 4090
MSI Titan GT77 HX 13VI : Intel Core i9-13950HX, 17.30", 3.5 kgReview » Nvidia Ada RTX 40 Laptop GPU analysis: 175 W RTX 4090 Laptop GPU surpasses a 350 W RTX 3090 in performance and power efficiency
SCHENKER XMG Neo 16 Raptor Lake : Intel Core i9-13900HX, 16.00"Review » Nvidia Ada RTX 40 Laptop GPU analysis: 175 W RTX 4090 Laptop GPU surpasses a 350 W RTX 3090 in performance and power efficiency
MSI Titan GT77 HX 13VI : Intel Core i9-13950HX, 17.30", 3.5 kgReview » MSI Titan GT77 HX 13V Review - Ultimate Gaming Laptop with RTX 4090 & Core i9-13950HX
SCHENKER XMG Neo 17 E23 : Intel Core i9-13900HX, 17.30", 2.8 kgExternal Review » SCHENKER XMG Neo 17 E23
Lenovo Legion 9 16IRX8 : Intel Core i9-13980HX, 16.00", 2.6 kgExternal Review » Lenovo Legion 9 16IRX8
MSI Stealth 17 Studio A13VI, i9-13900H : Intel Core i9-13900H, 17.30", 2.8 kgExternal Review » MSI Stealth 17 Studio A13VI, i9-13900H
Origin PC EON17-X 2023 : Intel Core i9-13900HX, 17.30", 3.3 kgExternal Review » Origin PC EON17-X 2023
MSI Raider GE78 HX 13VI : Intel Core i9-13980HX, 17.00", 3.1 kgExternal Review » MSI Raider GE78 HX 13VI
Lenovo Legion Pro 7 16IRX8H, i9-13900HX RTX 4090 : Intel Core i9-13900HX, 16.00", 2.8 kgExternal Review » Lenovo Legion Pro 7 16IRX8H, i9-13900HX RTX 4090
Asus ROG Zephyrus M16 GU604VY-NM001W : Intel Core i9-13900H, 16.00", 2.3 kgExternal Review » Asus ROG Zephyrus M16 GU604VY-NM001W
Acer Predator Triton 17X PTX17-71-99W5 : Intel Core i9-13900HX, 17.00", 3 kgExternal Review » Acer Predator Triton 17X PTX17-71-99W5
MSI Stealth 17 Studio A13VI : Intel Core i7-13700HX, 17.30", 2.8 kgExternal Review » MSI Stealth 17 Studio A13VI
Asus ROG Strix Scar 17 G733PY-XS96 : AMD Ryzen 9 7945HX, 17.30", 2.9 kgExternal Review » Asus ROG Strix Scar 17 G733PY-XS96
Aorus 17X AZF : Intel Core i9-13900HX, 17.30", 2.9 kgExternal Review » Aorus 17X AZF
Asus ROG Strix Scar 17 G733PY-LL002W : AMD Ryzen 9 7945HX, 17.30", 3 kgExternal Review » Asus ROG Strix Scar 17 G733PY-LL002W
Asus Zephyrus Duo 16 GX650PY-NM006W : AMD Ryzen 9 7945HX, 16.00", 2.7 kgExternal Review » Asus Zephyrus Duo 16 GX650PY-NM006W
Asus ROG Zephyrus G14 GA402XY : AMD Ryzen 9 7940HS, 14.00", 1.7 kgExternal Review » Asus ROG Zephyrus G14 GA402XY
Razer Blade 18 2023, RTX 4090 : Intel Core i9-13950HX, 18.00", 3.2 kgExternal Review » Razer Blade 18 2023, RTX 4090
Alienware m18 R1 : Intel Core i9-13980HX, 18.00", 3.9 kgExternal Review » Alienware m18 R1
Asus ROG Strix Scar 16 G634JY-NM001W : Intel Core i9-13980HX, 16.00", 2.5 kgExternal Review » Asus ROG Strix Scar 16 2023 G634JY-NM001W
SCHENKER XMG Neo 16 E23 : Intel Core i9-13900HX, 16.00", 2.5 kgExternal Review » Schenker XMG Neo 16 E23
Medion Erazer Beast X40 : Intel Core i9-13900HX, 17.00", 2.9 kgExternal Review » Medion Erazer Beast X40
MSI Titan GT77 HX 13VI : Intel Core i9-13950HX, 17.30", 3.5 kgExternal Review » MSI Titan GT77 HX 13VI
MSI Titan GT77 HX 13VI-044 : Intel Core i9-13980HX, 17.30", 3.3 kgExternal Review » MSI Titan GT77 HX 13VI-044
Razer Blade 16 Early 2023 RTX 4090 : Intel Core i9-13950HX, 16.00", 2.5 kgExternal Review » Razer Blade 16 Early 2023 RTX 4090
Asus ROG Strix Scar 18 2023 G834JY-N6005W : Intel Core i9-13980HX, 18.00", 3.1 kgExternal Review » Asus ROG Strix Scar 18 2023 G834JY-N6005W
Asus ROG Zephyrus M16 GU604VY-NM042X : Intel Core i9-13900H, 16.00", 2.3 kgExternal Review » Asus ROG Zephyrus M16 GU604VY-NM042X
Asus Zephyrus Duo 16 GX650PY-NM006W : AMD Ryzen 9 7945HX, 16.00", 2.7 kgArticle » AMD strikes back: Ryzen 9 7945HX beats Intel Core i9-13980HX despite much lower power consumption
Alienware m18 R1 : Intel Core i9-13980HX, 18.00", 3.9 kgBeastly Alienware m18 with RTX 4080, i9-13900HX and 480Hz display now 25% off in Dell's gaming laptop sale
Eluktronics Mech-17 GP2 Liquid Propulsion Package G2 : Intel Core i9-13900HXThese are the fastest and slowest GeForce RTX 4090 laptops you can now buy
Asus ROG Zephyrus M16 GU604V : Intel Core i9-13900H, 16.00", 2.3 kgAsus ROG Zephyrus M16 (2023) review: Neither Intel Gen 13 nor RTX 40 - OLED and Mini-LED displays are the new laptop's highlights
Alienware m18 R1 : Intel Core i9-13980HX, 18.00", 3.9 kgRazer is ahead of the curve when it comes to small and compact 330 W AC adapters
Medion Erazer Beast X40 : Intel Core i9-13900HX, 17.00", 2.9 kgMedion Erazer Beast X40: High-end gaming with RTX 4090 and optional water cooling
Asus Zephyrus Duo 16 GX650PY-NM006W : AMD Ryzen 9 7945HX, 16.00", 2.7 kgAsus ships the ROG Zephyrus Duo 16 with AMD's Ryzen 9 7945HX, the fastest mobile processor available
Please share our article, every link counts!
» Comparison of GPUs
» Benchmark List
» Notebook Gaming List
Class 1 Arc A750
Class 2 M3 Max 40-Core GPU *
M3 Pro 18-Core GPU *
Radeon PRO W6600M *
Class 3 UHD Graphics 750
Class 4
Class 5 * Approximate position of the graphics adapter
Working For Notebookcheck
Are you a techie who knows how to translate? Then join our Team!
Details here
Top 10 Laptops Multimedia , Budget Multimedia , Gaming , Budget Gaming , Lightweight Gaming , Business , Budget Office , Workstation , Subnotebooks , Ultrabooks , Chromebooks
under 300 USD/Euros , under 500 USD/Euros , 1,000 USD/Euros , for University Students , Best Displays
Top 10 Smartphones Smartphones , Phablets , ≤6-inch , Camera Smartphones
Klaus Hinum (Update: 2022-12-19)
 Deutsch
 English
 Español
 Français
 Italiano
 Nederlands
 Polski
 Português
 Русский
 Türkçe
 Svenska
 Chinese
 Magyar